Six Months of Buying Intent. Ten Consistent Risers, Ten Chronic Fallers.
BuyingIntent.in examines the brands that repeatedly gained or lost consumer Buying Intent between March and August 2026, including some that moved against their category trends.
A brand’s Buying Intent can change considerably over six months. There may be sudden increases, occasional reversals and periods of relative stability. However, when the readings repeatedly move in the same direction, the cumulative change can be substantial.
We examined six months of BuyingIntent.in data, from March to August 2026, to identify brands that have shown consistent upward or downward movement. The exercise reveals some striking gains and declines among established brands, along with interesting differences between individual brands and their wider categories.
For this analysis, consistency was defined as movement in the same direction in at least four of the five month-to-month transitions. Brands were required to have a March Buying Intent index of at least 100, with a minimum of five top-five mentions in March and ten in August. These conditions were applied to keep brands with extremely small starting bases or thin response representation out of the principal comparison.
The qualifying brands were then ranked by their net percentage change in Buying Intent between March and August.
The Consistent Risers
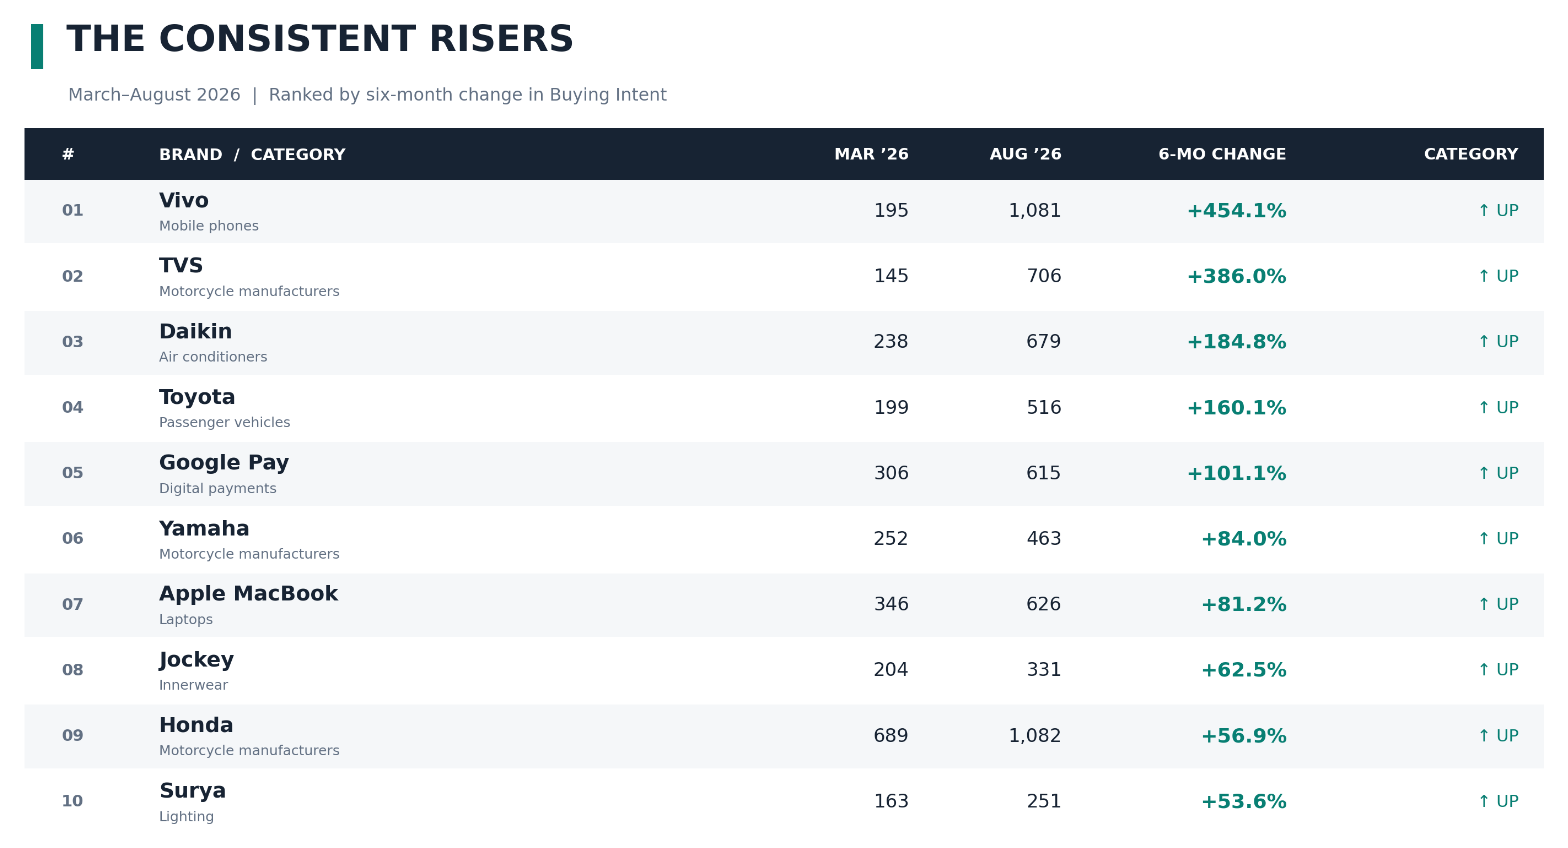
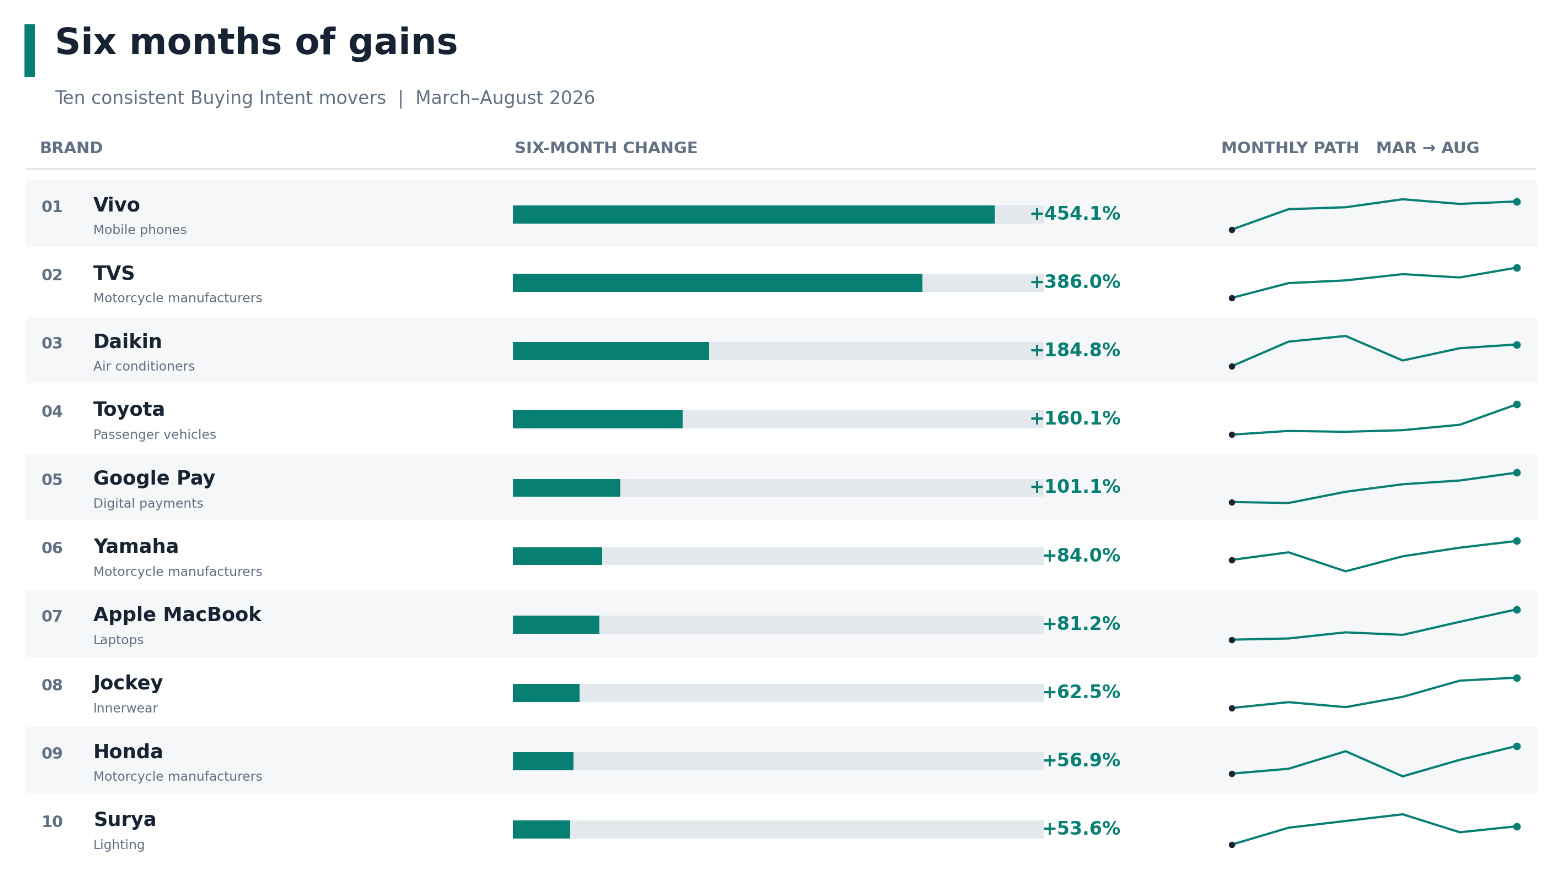
Vivo leads the consistent risers, with Buying Intent increasing 454.1% over the six months. Its index rose from 195 in March to 1,081 in August. The brand made a substantial jump in April, continued gaining until June, experienced a decline in July and recovered in August.
TVS followed with a 386% improvement, moving from 145 to 706. Its rise is particularly interesting when considered alongside Yamaha and Honda, which also feature among the ten consistent risers.
The Motorcycle Manufacturers category increased from 1.7 to 3.7 over the same period, an improvement of 117.6%. It was the only category in the study to record an increase in every one of the five monthly transitions. The presence of three motorcycle manufacturers among the leading brand risers reflects the broader improvement in category Buying Intent, although the magnitude of their individual gains differed considerably.
Daikin recorded the third-largest improvement at 184.8%. Its trajectory is an interesting example of how considerable monthly fluctuations can occur within a sustained six-month rise. Daikin reached an index of 851 in May, declined sharply to 356 in June and recovered to 679 by August.
Toyota, Google Pay, Yamaha, Apple MacBook, Jockey, Honda and Surya complete the ten consistent risers, each recording improvements exceeding 50% over the six-month period.
Six-month Buying Intent trajectories of the risers
The Chronic Fallers
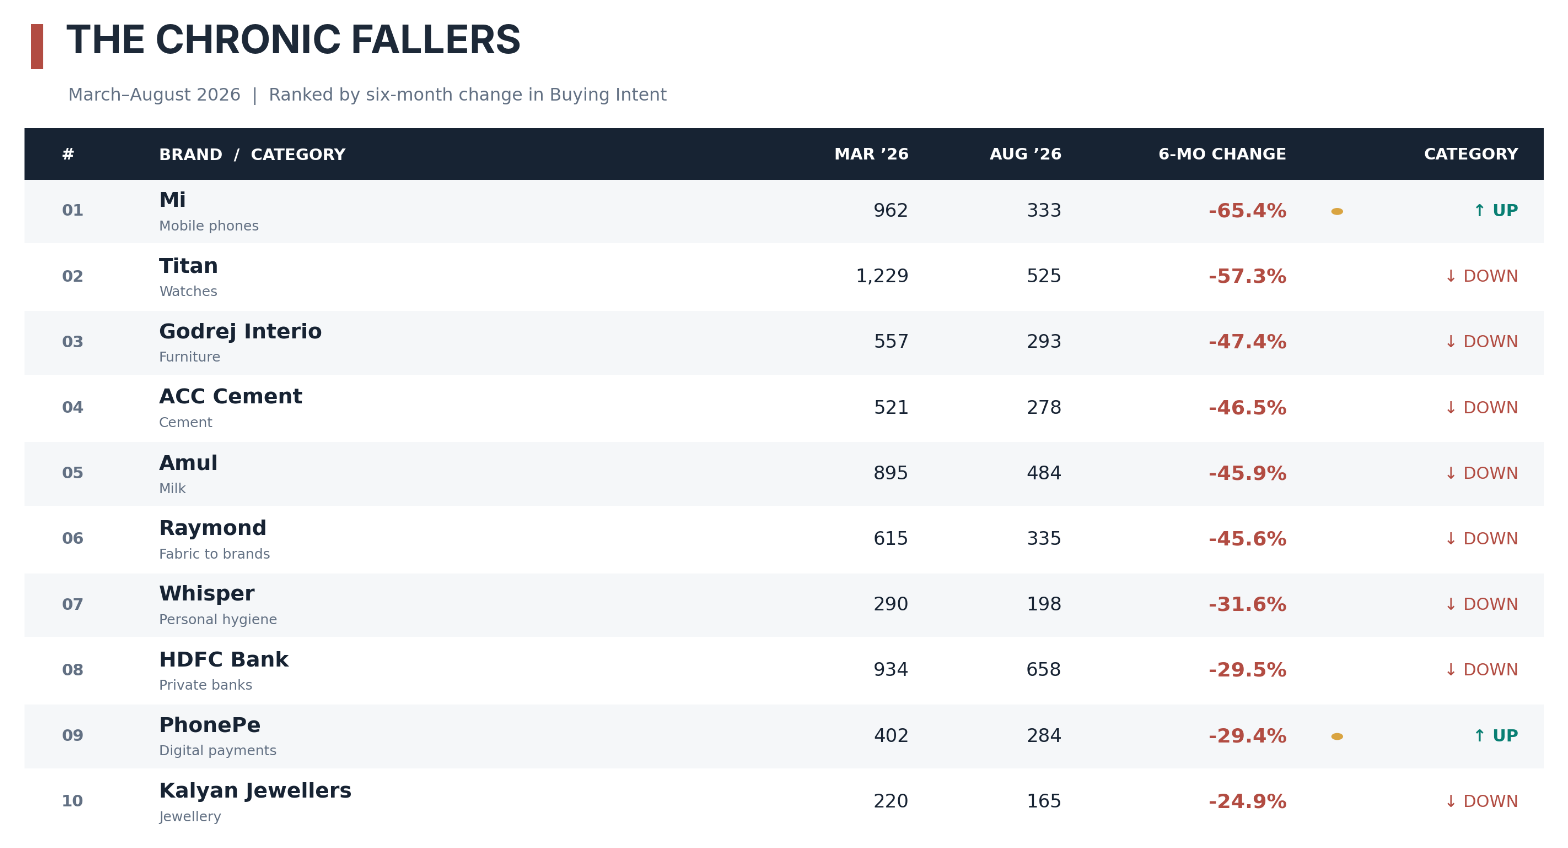
Mi recorded the largest decline among the qualifying brands, with its Buying Intent falling 65.4% between March and August. It began the period with an index of 962, substantially ahead of Vivo’s 195. By August, Mi had declined to 333, while Vivo had reached 1,081.
Titan followed with a 57.3% decline, although its six-month trajectory was considerably more uneven. After falling sharply in April, Titan recovered to an index of 1,421 in May, above its March reading of 1,229. Its Buying Intent subsequently declined in each of the following three months, reaching 525 in August.
Godrej Interio, ACC Cement, Amul Milk and Raymond recorded declines ranging from 45.6% to 47.4%. All four moved in the same direction as their respective categories over the six-month period.
Whisper presents a particularly interesting case. Its Buying Intent declined in every single month, moving from 290 in March to 198 in August. Among the twenty brands selected for this analysis, Whisper was the only one to record an uninterrupted movement across all five monthly transitions.
HDFC Bank’s Buying Intent declined for four consecutive months before recovering in August. Its August index of 658, however, remained 29.5% below March. PhonePe and Kalyan Jewellers complete the ten chronic fallers, with declines of 29.4% and 24.9%, respectively.
Six-month Buying Intent trajectories of the fallers
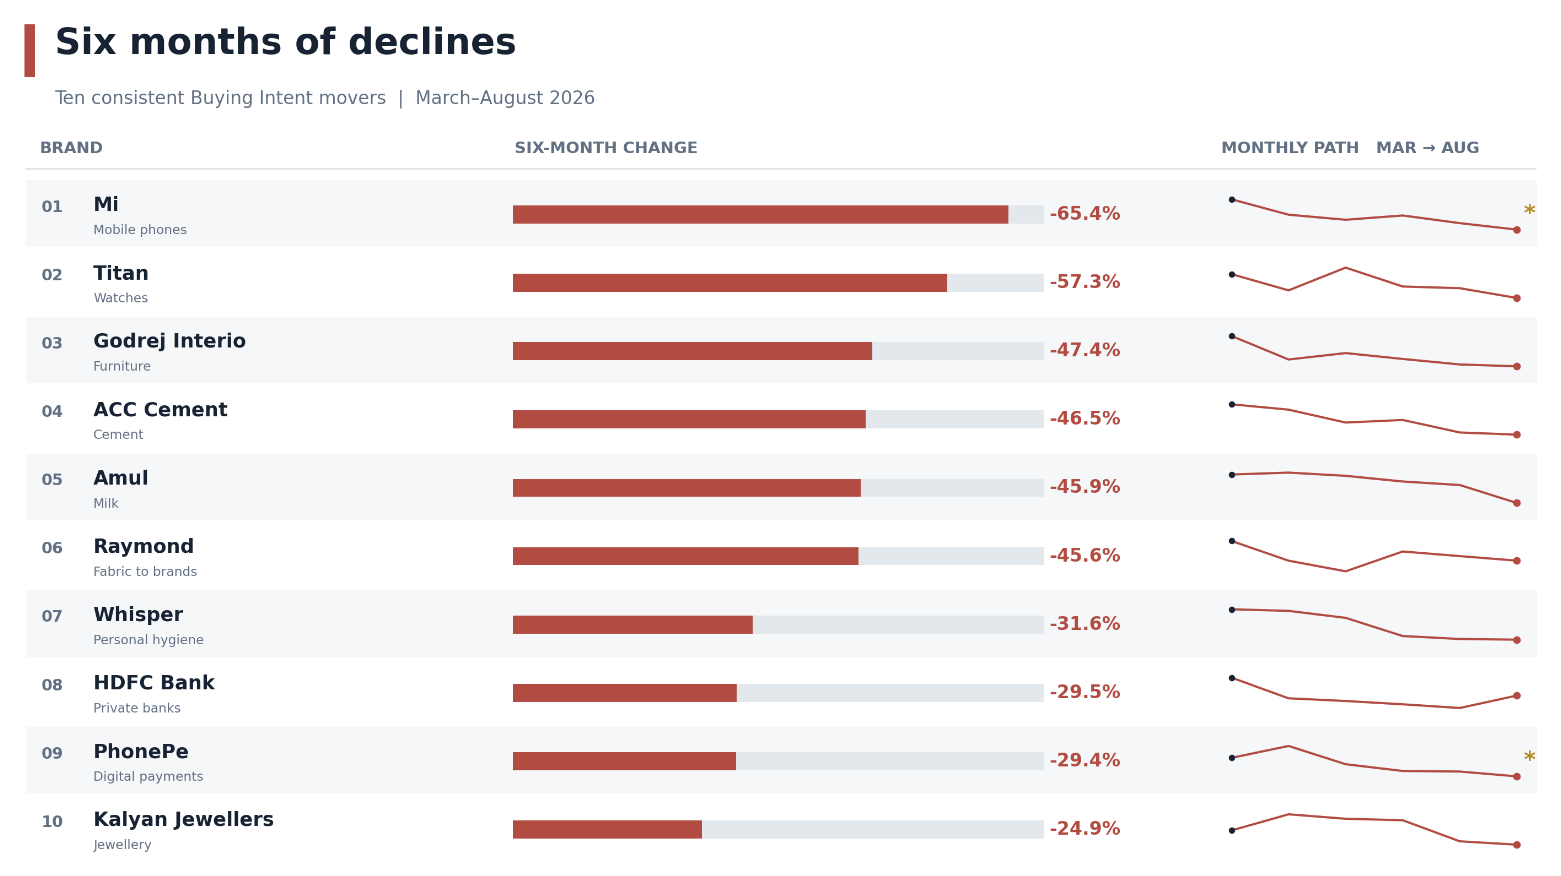
Mi and PhonePe carry an asterisk: both fell while their categories rose over the same six months.
When a Brand Moves Against Its Category
One of the more interesting findings emerges when the movements of individual brands are compared with those of their categories.
The Mobile Phones category’s Buying Intent increased 20% between March and August, moving from 4.5 to 5.4. During the same period, Vivo recorded a 454.1% improvement while Mi declined 65.4%.
The six-month change in the category provides little indication of the extent to which these two brands moved apart. In March, Mi’s Buying Intent index was almost five times Vivo’s. By August, Vivo’s index was more than three times Mi’s.
A similar divergence emerged in Digital Payments.
The category’s Buying Intent increased 50% over the period. Google Pay recorded a 101.1% improvement, while PhonePe declined 29.4%.
Both examples are particularly relevant when interpreting brand performance through category-level data. The overall improvement in Buying Intent reflects the direction of the category, but the individual brand movements reveal considerable differences within it.
The Motorcycle Manufacturers category offers a contrasting example. Its consistent upward movement was accompanied by improvements in TVS, Yamaha and Honda. All three participated in the category’s rising Buying Intent, although their individual six-month gains were substantially different.
What the Six-Month Movements Suggest
Two observations stand out from this analysis.
The first concerns the persistence of a brand’s movement. Whisper’s 31.6% decline was smaller than that of six other brands in the fallers list, yet its Buying Intent declined in every month. HDFC Bank, by comparison, recovered in August after four consecutive declines. The magnitude of the six-month change is important, but the monthly progression adds considerably to our understanding of how that change developed.
The second concerns the relationship between brands and their categories. Vivo and Mi, and Google Pay and PhonePe, demonstrate how substantially individual brands can diverge even when their categories are experiencing an overall improvement in Buying Intent.
For brand teams examining their own performance, these differences raise questions worth investigating. Is the brand’s movement shared by its category? Is it gaining while competitors weaken? How persistent has its movement been, and has the direction changed in the latest reading?
Six months of monthly Buying Intent data provides a useful starting point for answering these questions. The twenty brands examined here show how much can change within that relatively short period, and how differently those changes can develop.
Source: BuyingIntent.in, March–August 2026. The study covers consumer Buying Intent across 16 Indian cities. Brand and category index values are normalised on different scales, with April 2025 as the base. Percentage changes represent movements in the respective indexes. Published values are rounded; percentage changes are calculated using underlying readings. The consistency and response-base thresholds used in this article are editorial selection criteria.