BII Reports

Published reports from the Buying Intent Index

Category and market readings built on stored Buying Intent, Trust and Desire figures. Each report is free to read here and to download.

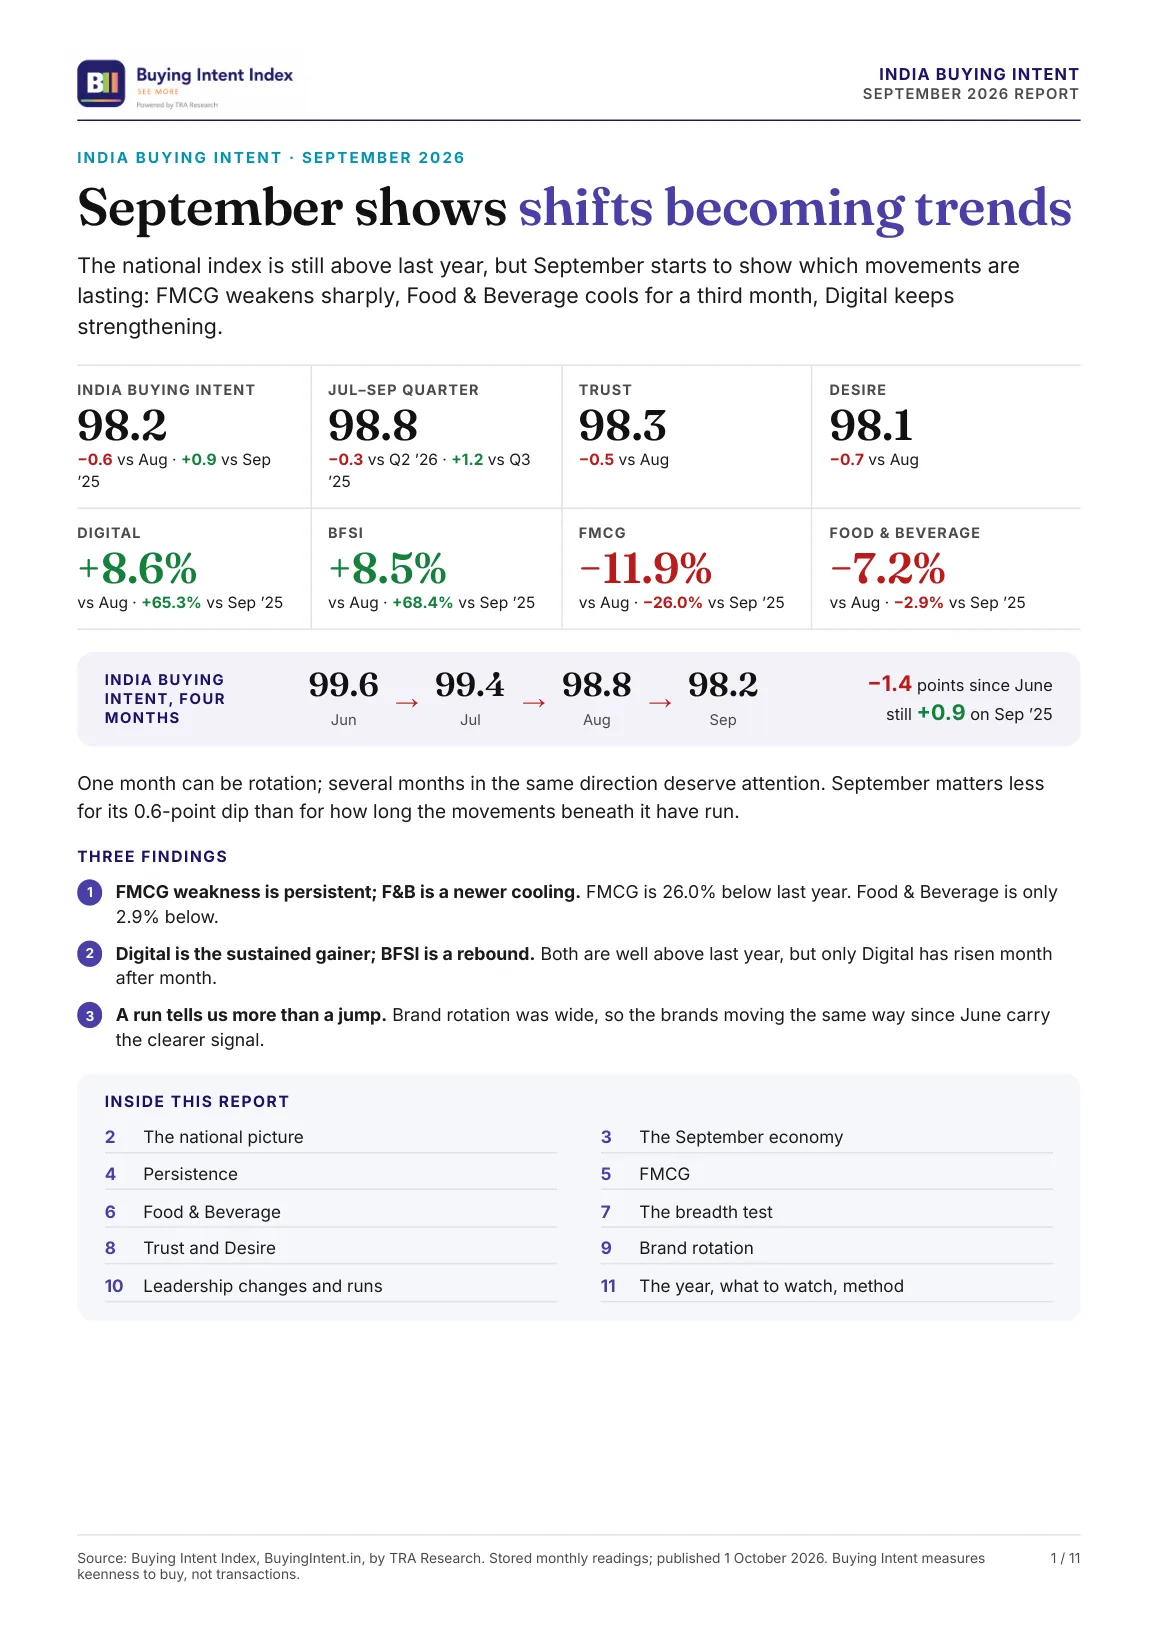
Page 1: September at a glance, India Buying Intent at 98.2, and three findings
Page 1 of 11
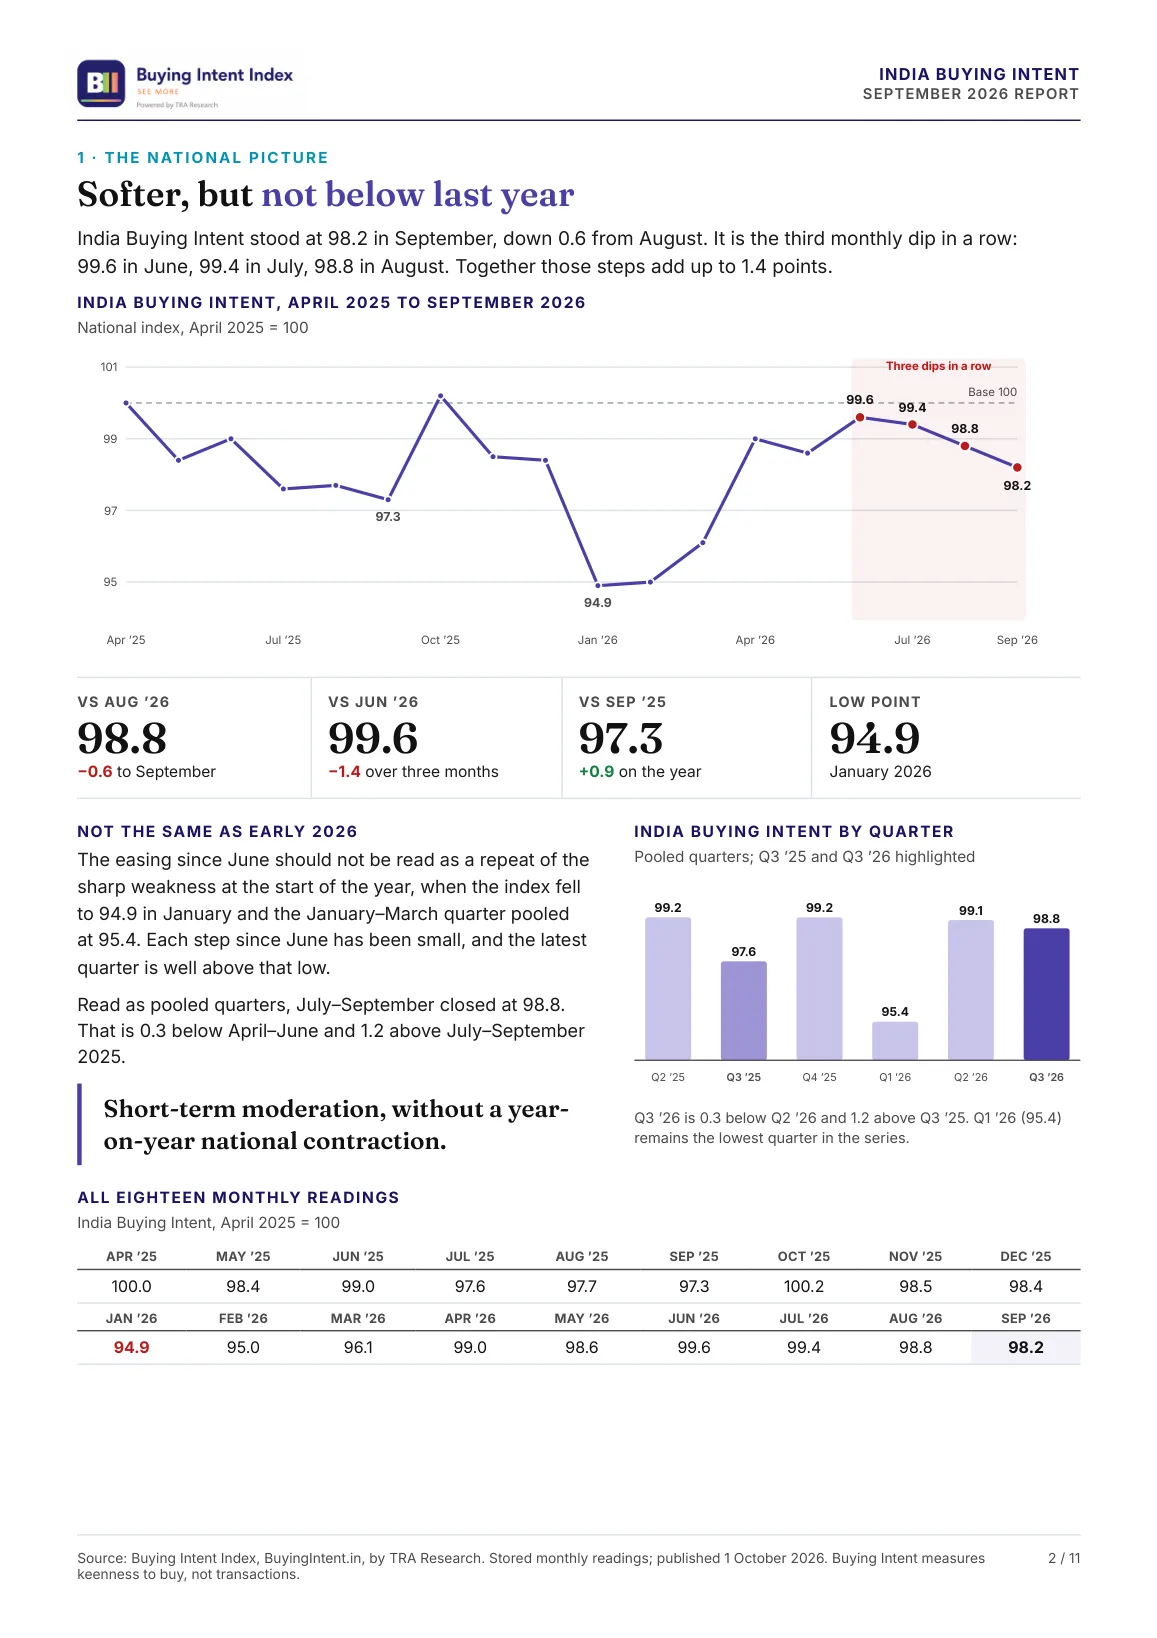
Page 2: the national picture, the 18-month chart, quarters and all monthly readings
Page 2 of 11
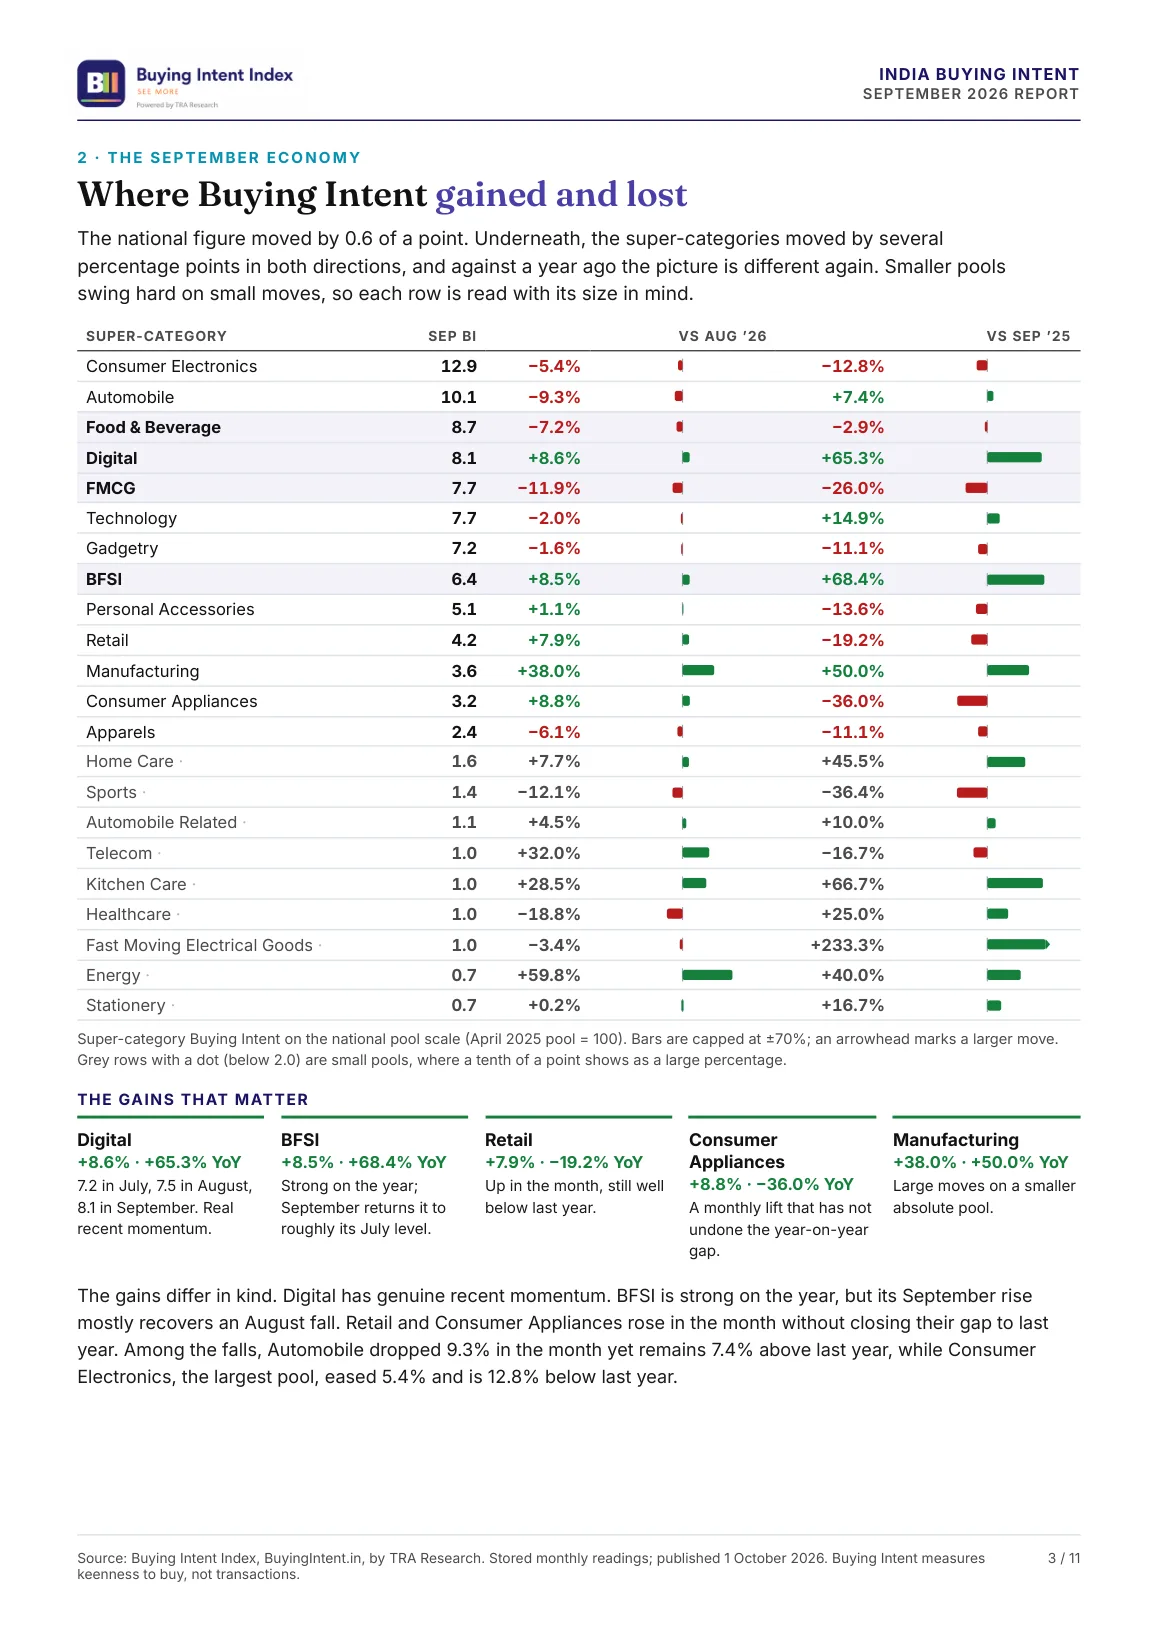
Page 3: every super-category against August and September 2025, and the gains that matter
Page 3 of 11
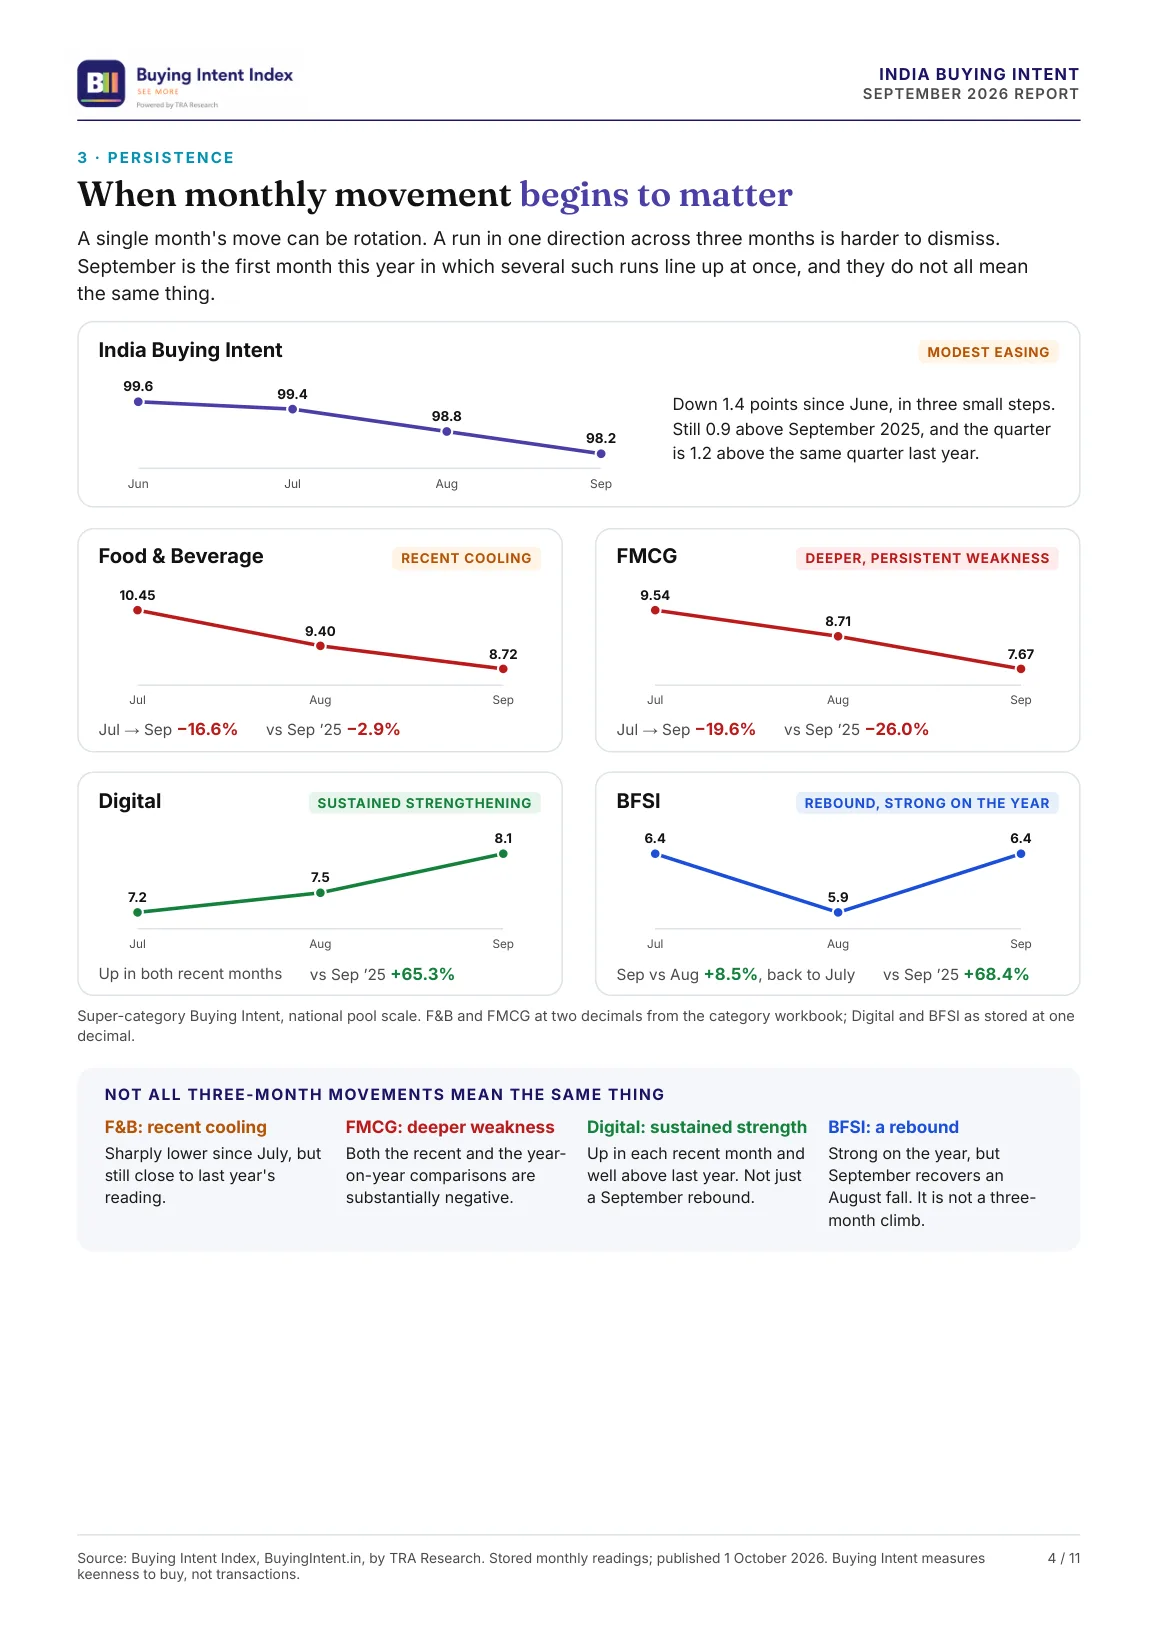
Page 4: persistence, three-month movements in the national index, Food & Beverage, FMCG, Digital and BFSI
Page 4 of 11
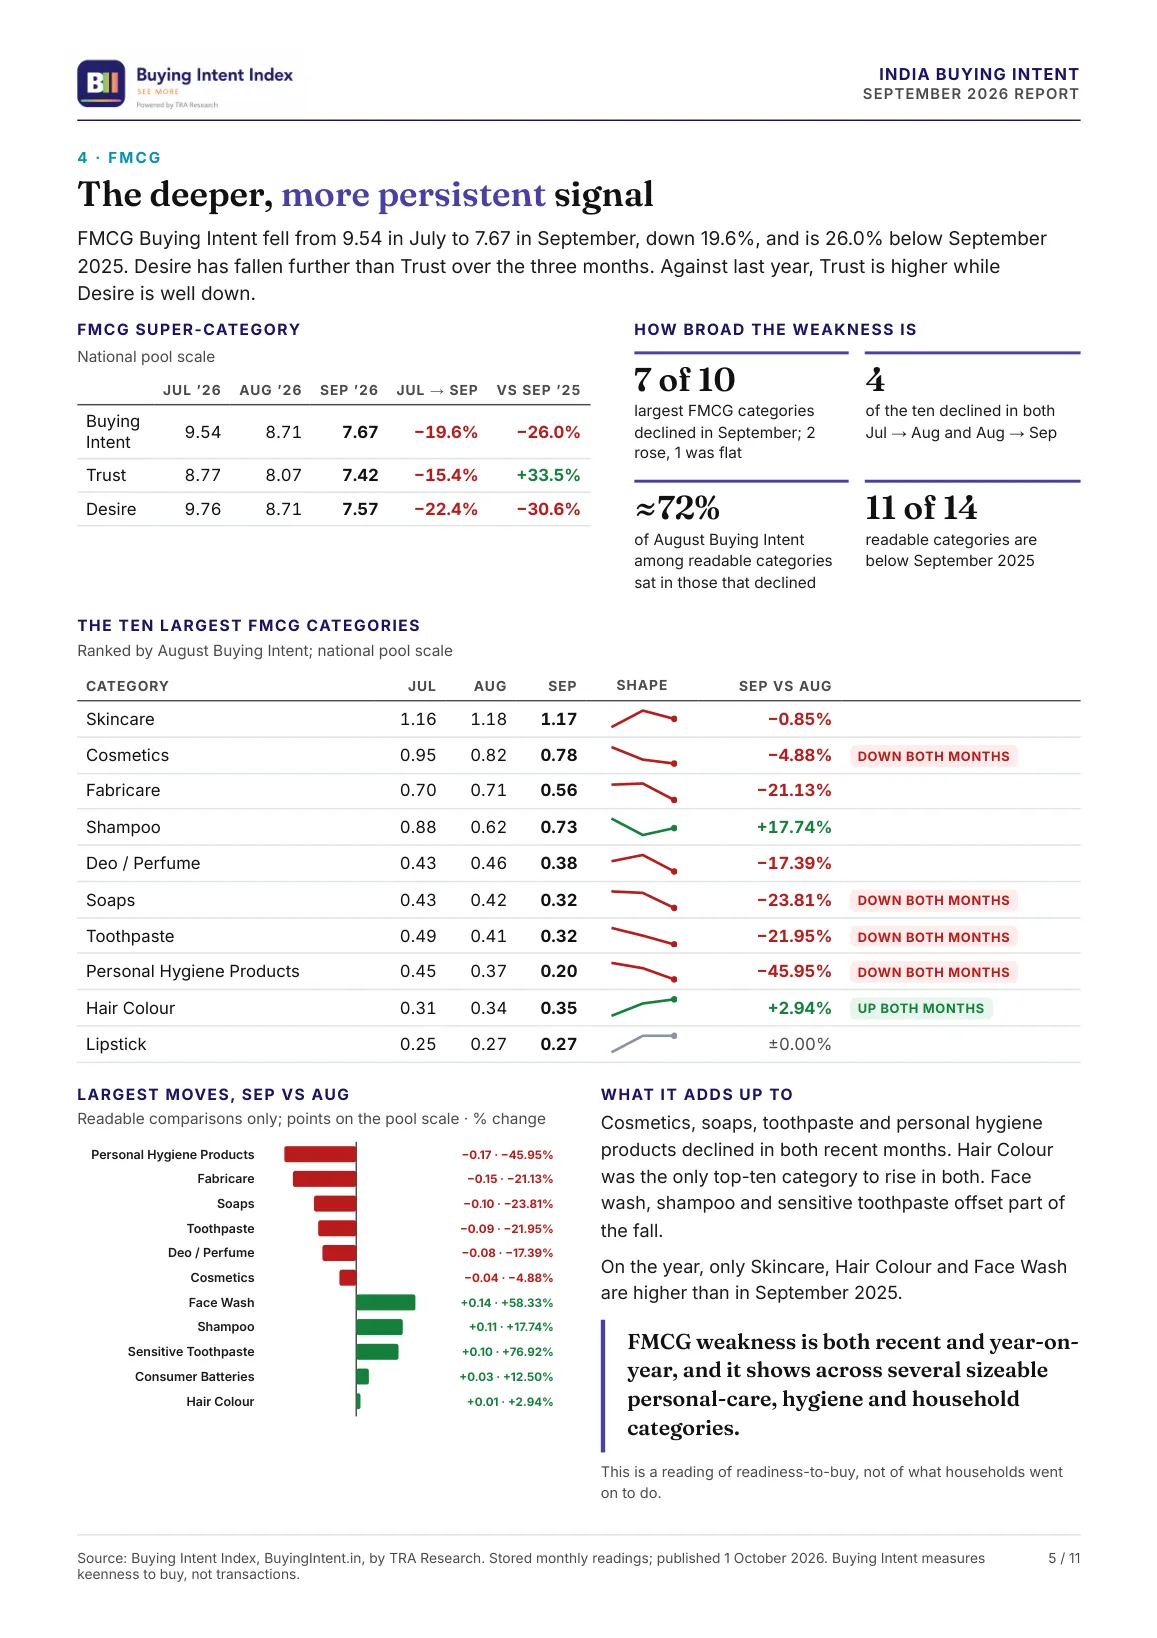
Page 5: FMCG, the ten largest categories, how broad the weakness is and the largest moves
Page 5 of 11
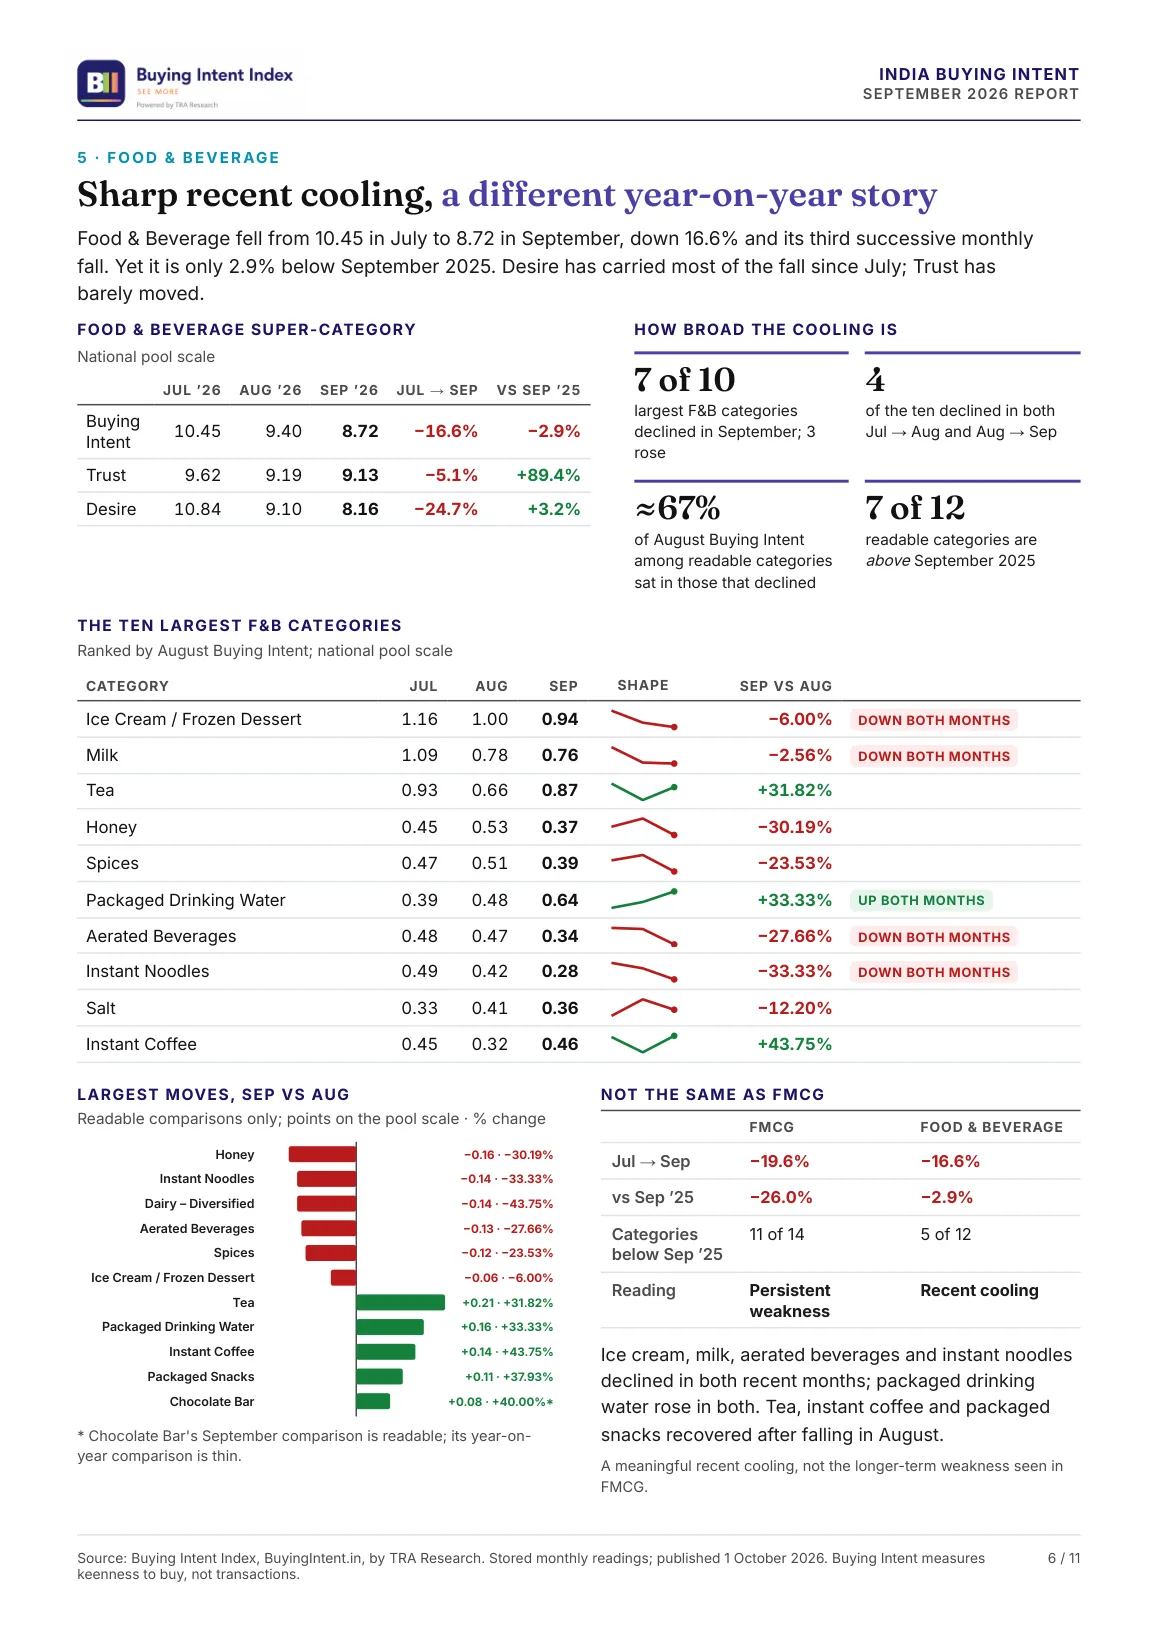
Page 6: Food & Beverage, the ten largest categories and how its cooling differs from FMCG
Page 6 of 11
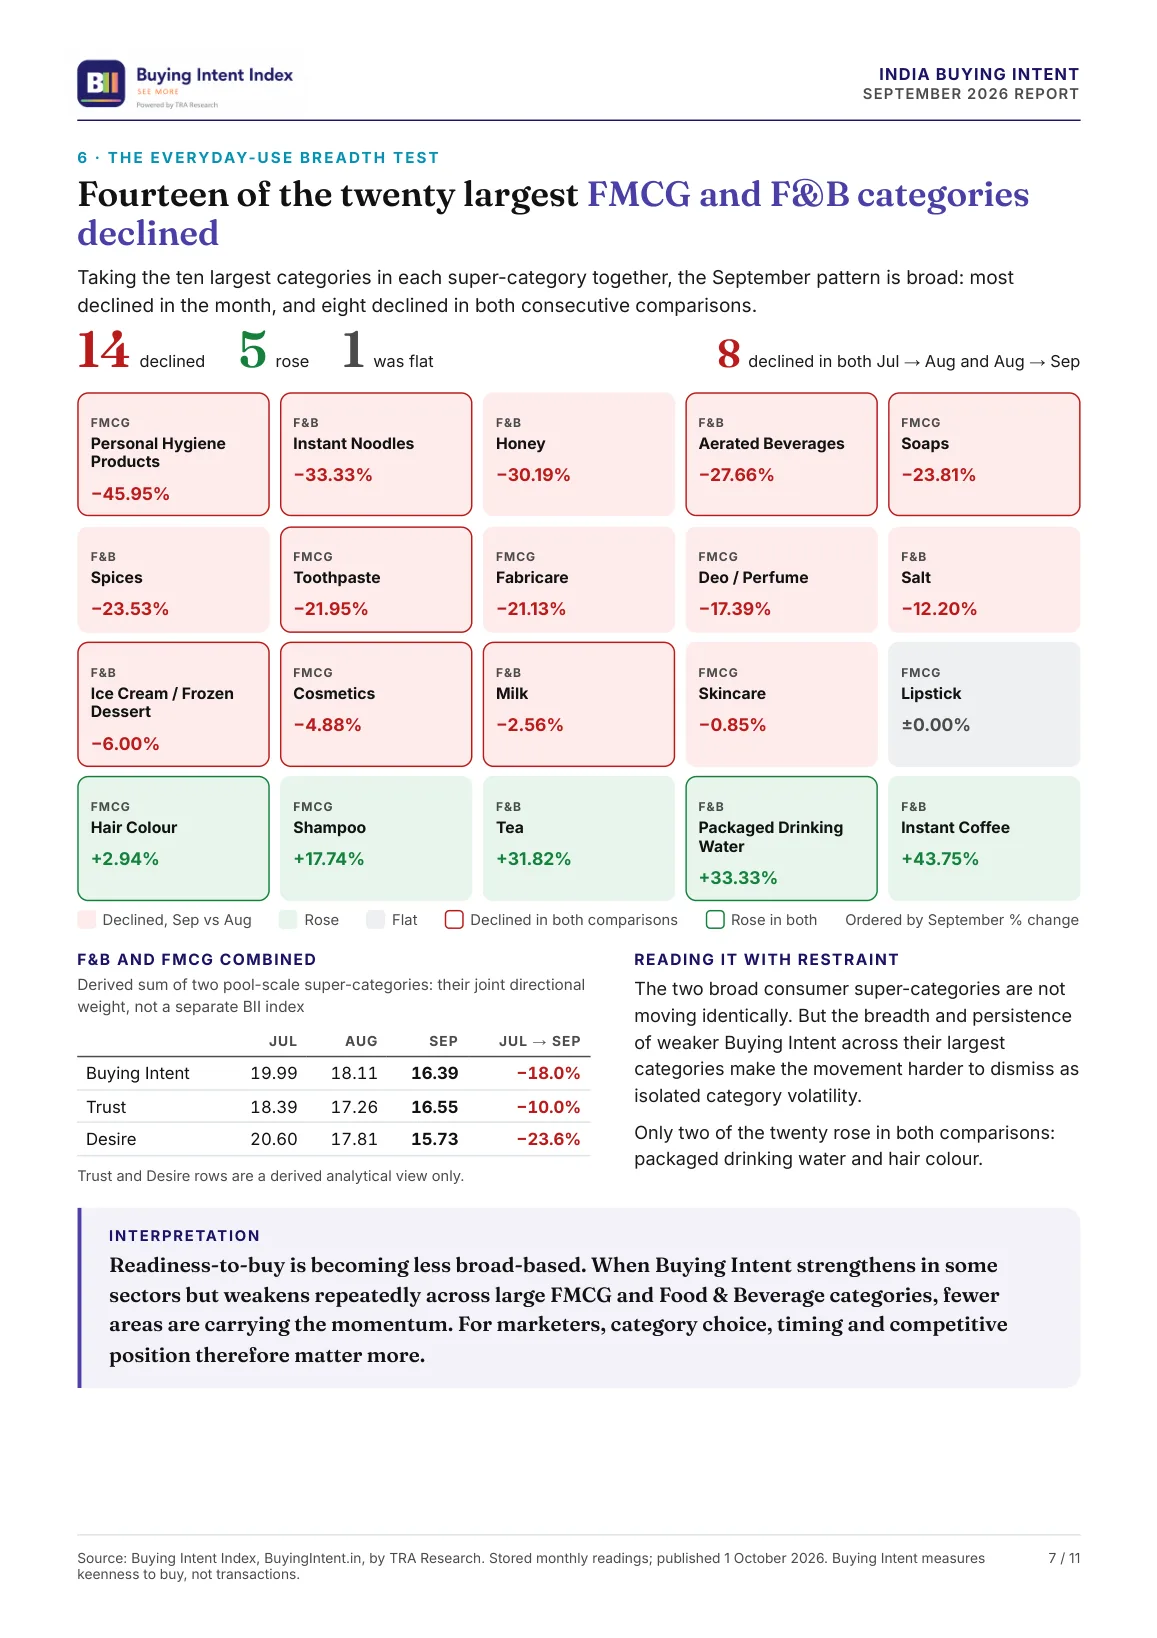
Page 7: the breadth test across the twenty largest FMCG and Food & Beverage categories, and the interpretation
Page 7 of 11
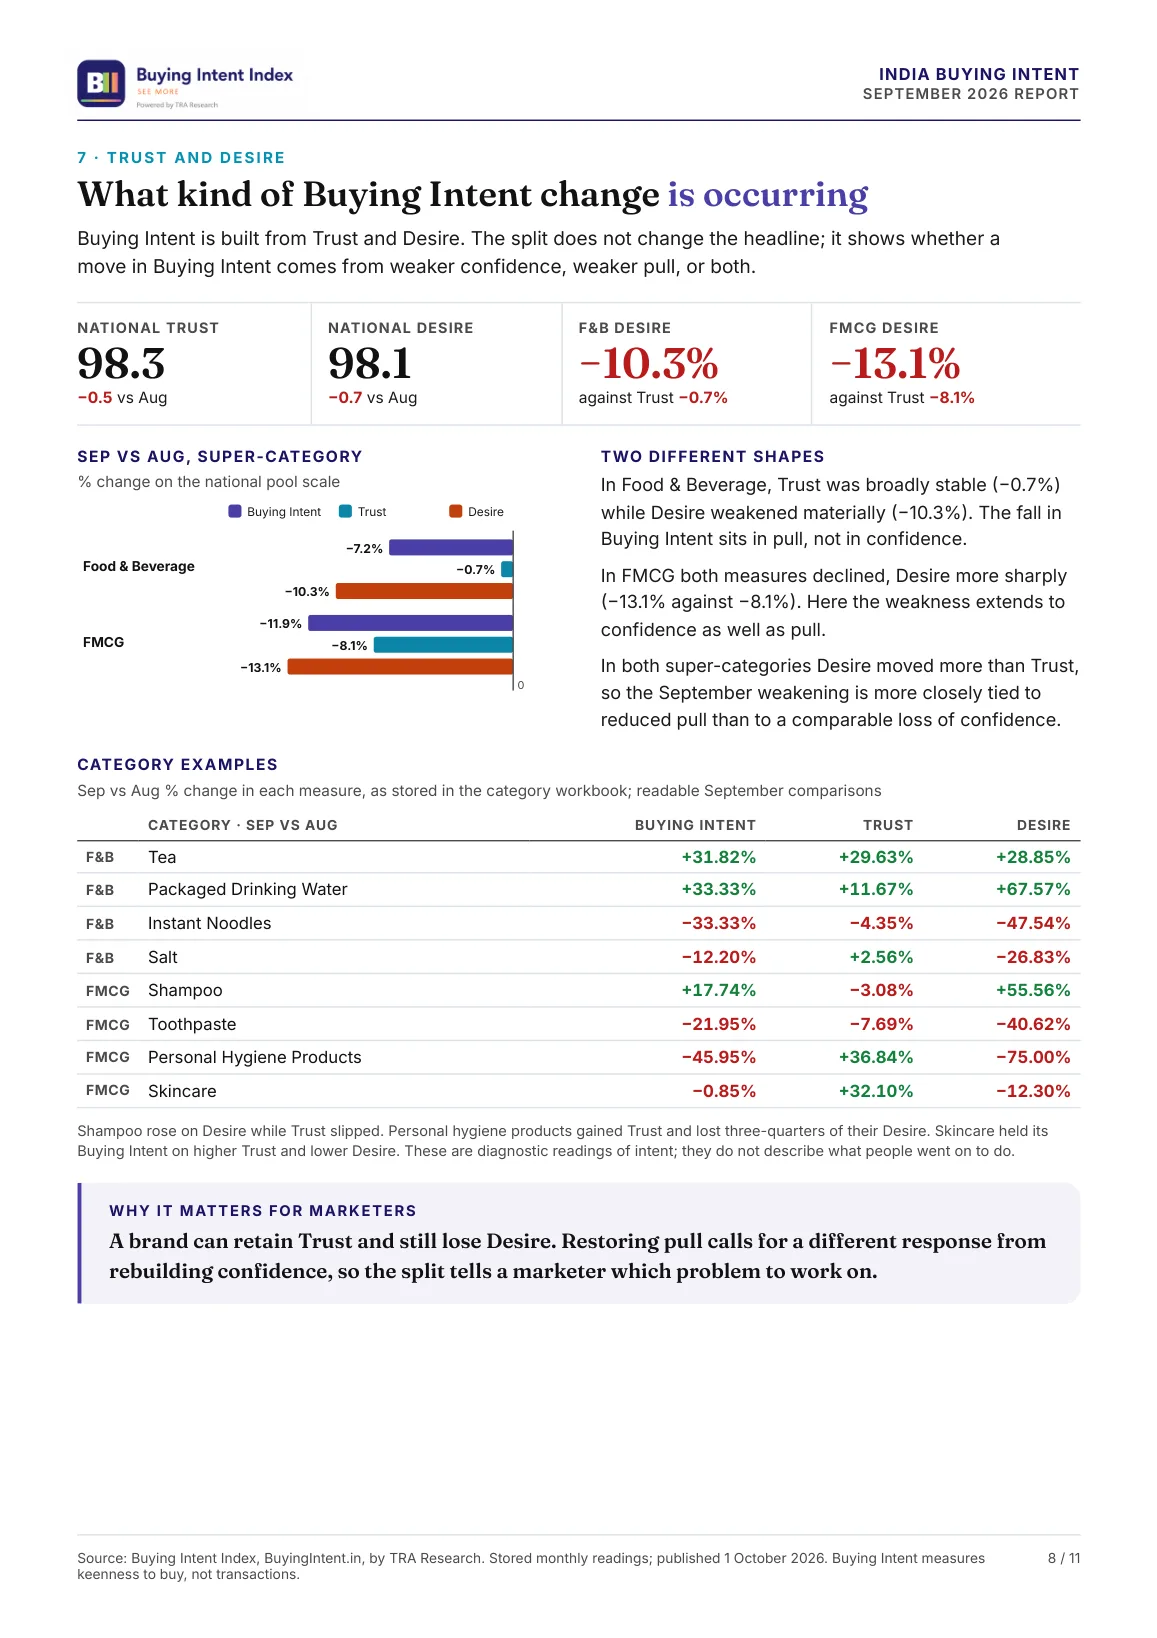
Page 8: what kind of Buying Intent change is occurring: Trust and Desire, with category examples
Page 8 of 11
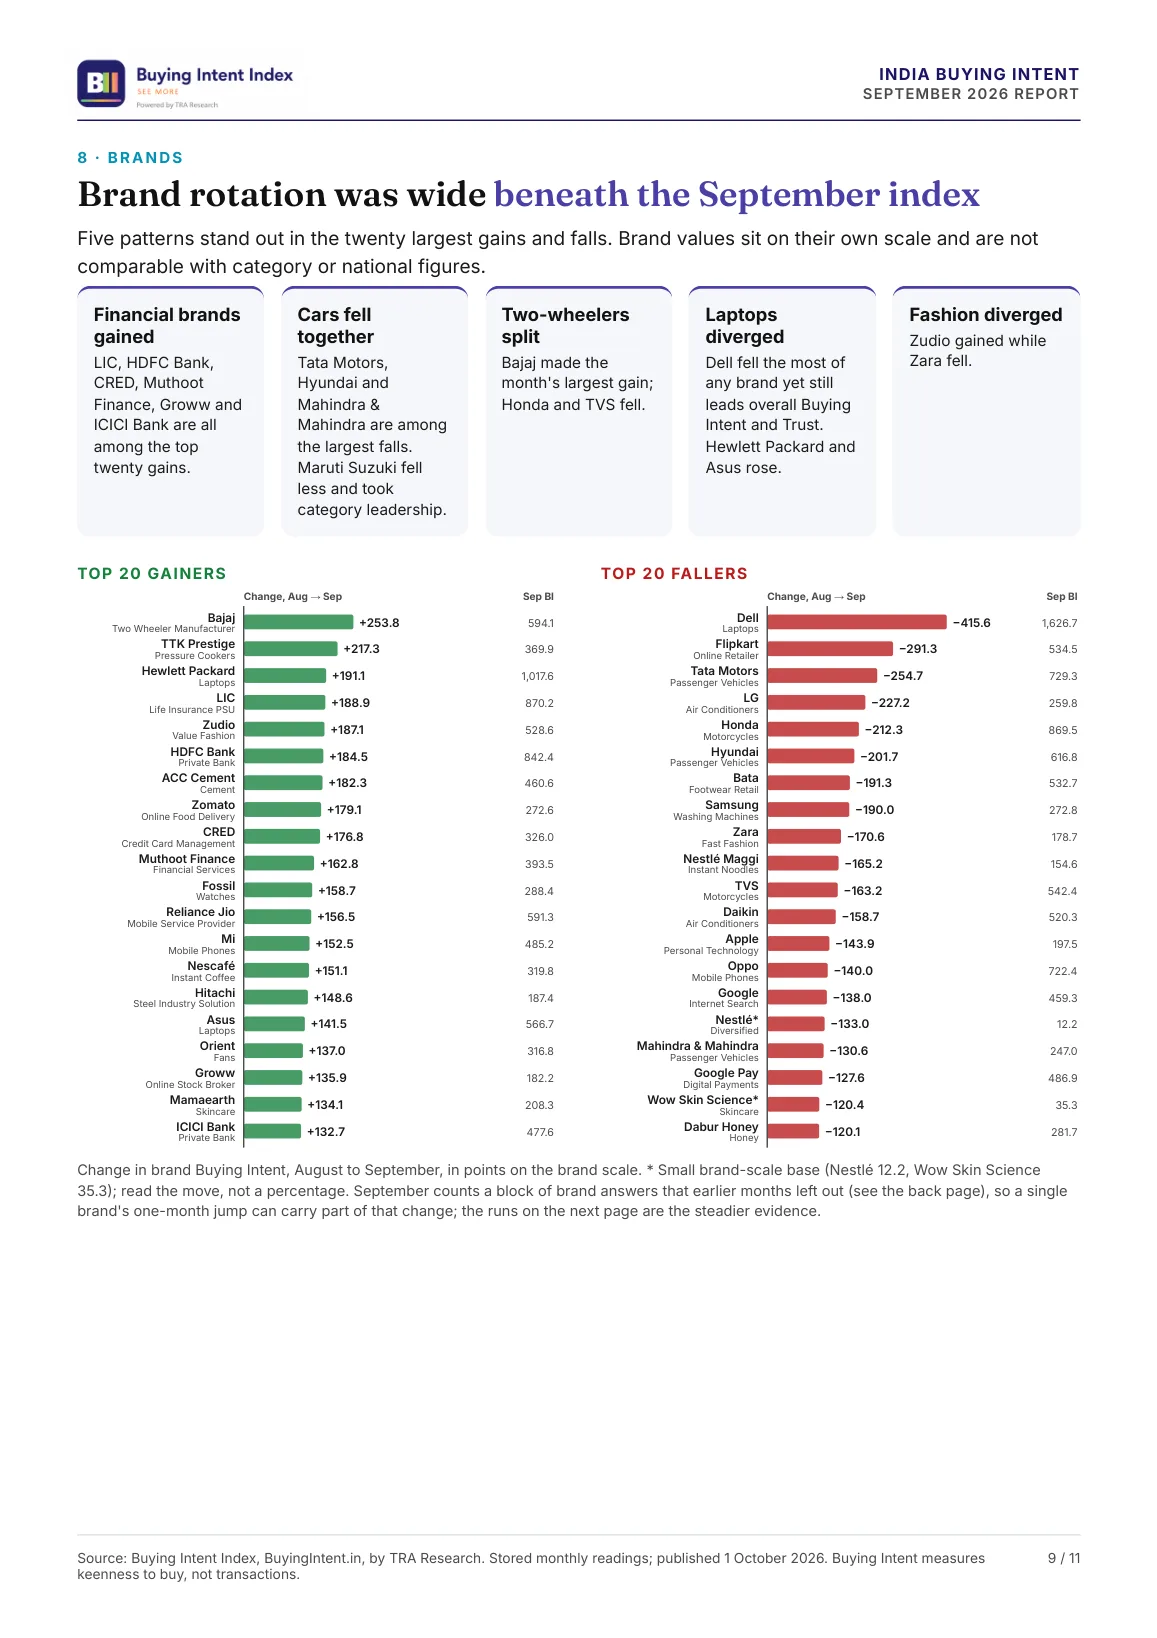
Page 9: brand rotation beneath the September index: five patterns and the twenty biggest gains and falls
Page 9 of 11
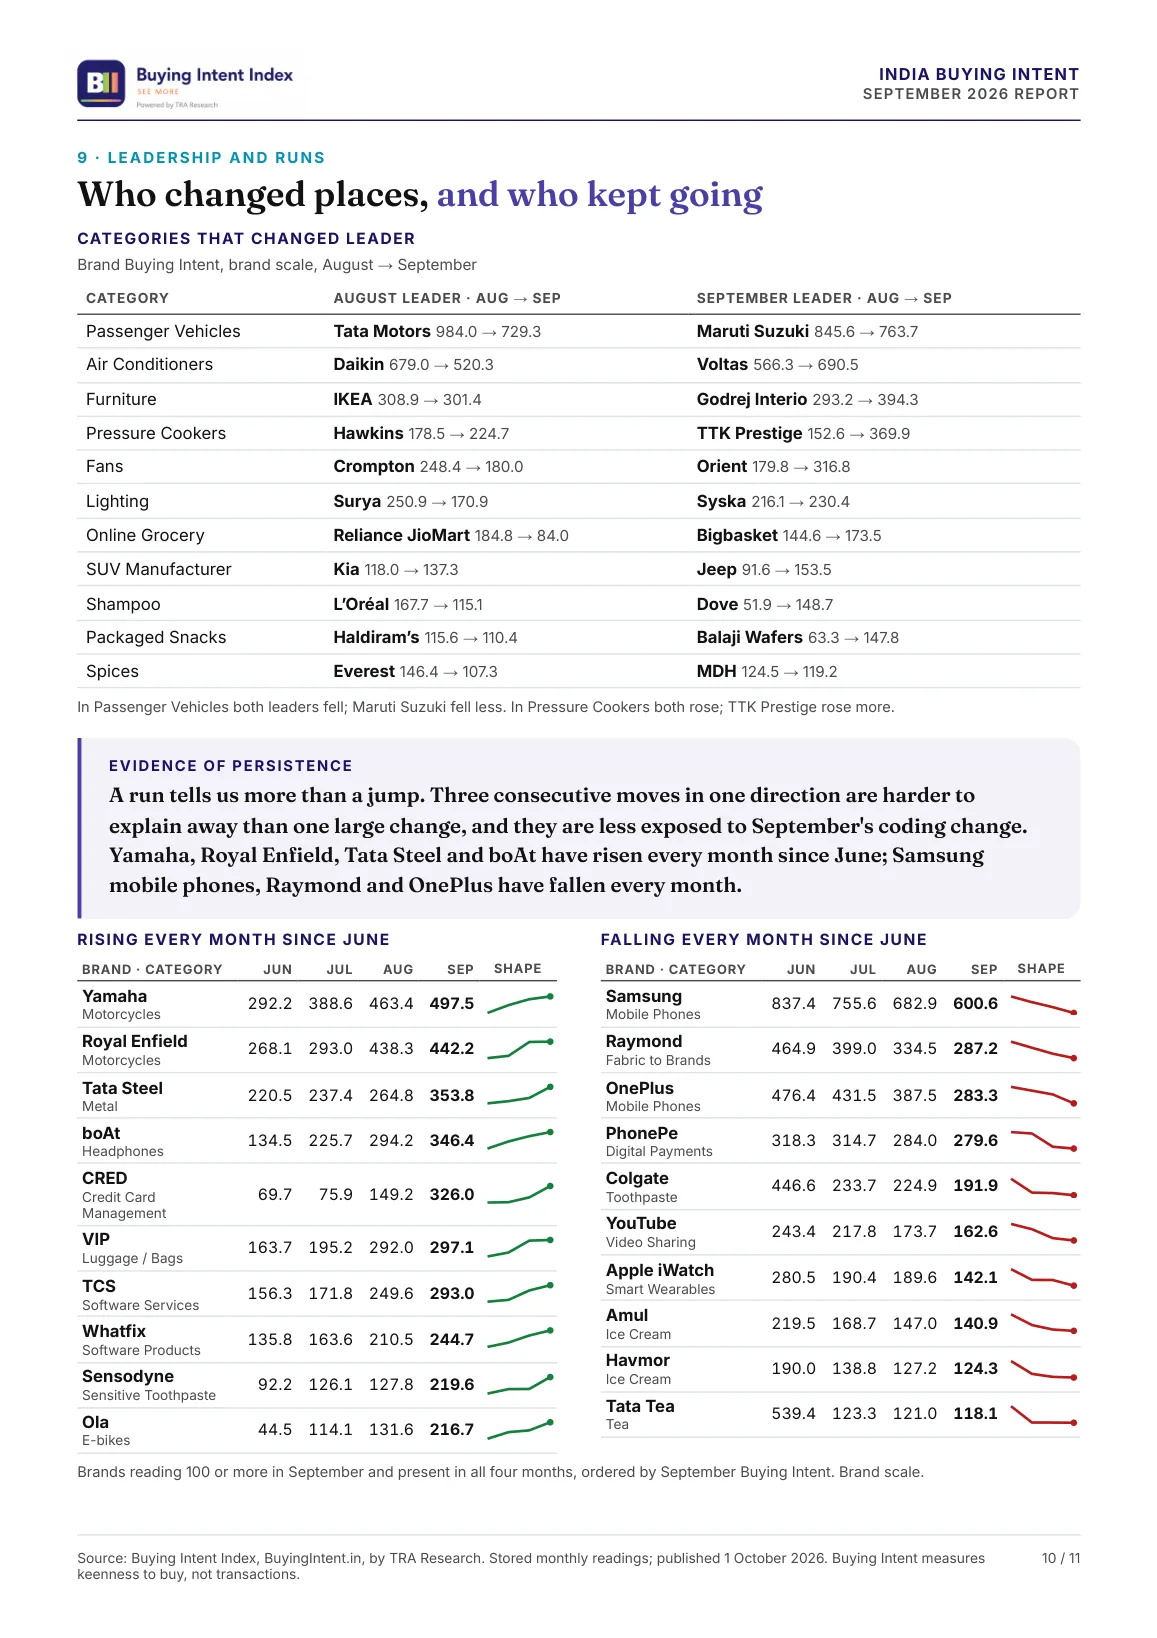
Page 10: categories that changed leader, and brands rising or falling every month since June
Page 10 of 11
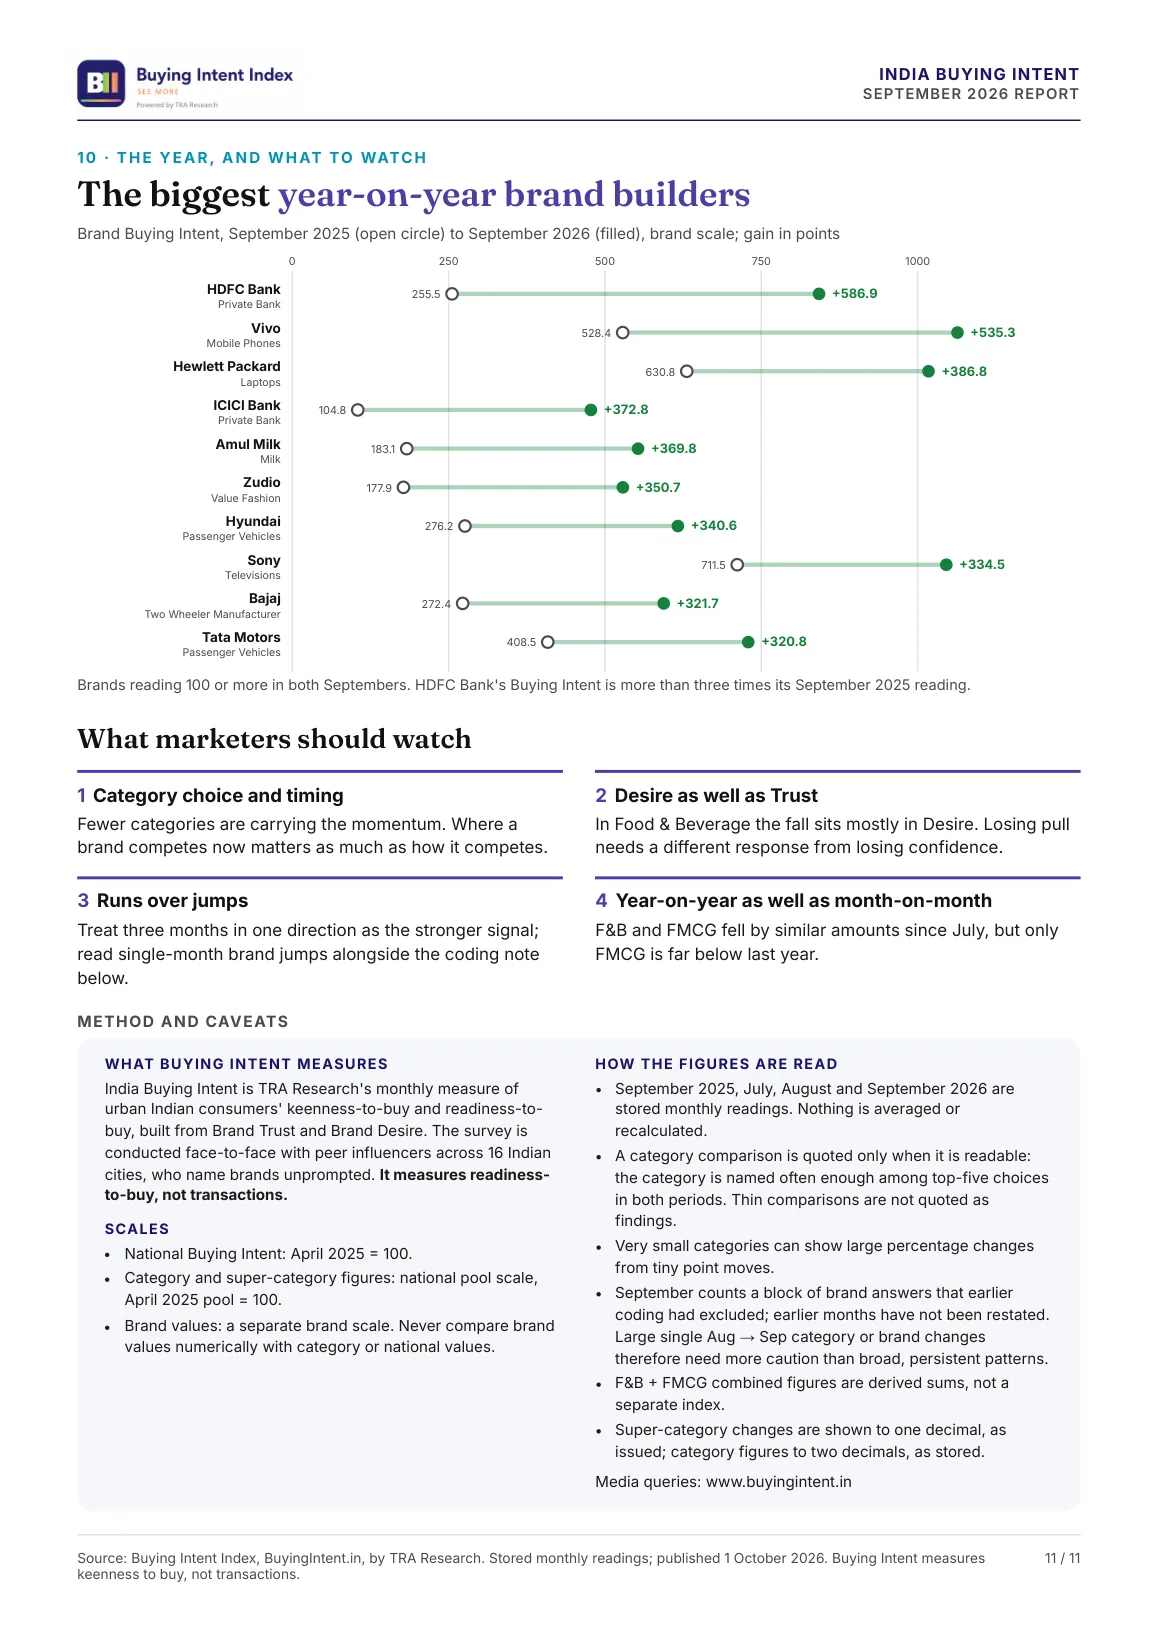
Page 11: the biggest year-on-year brand builders, what marketers should watch, and how the figures are read
Page 11 of 11