BII Reports

Published reports from the Buying Intent Index

Category and market readings built on stored Buying Intent, Trust and Desire figures. Each report is free to read here and to download.

India Buying Intent eases to 98.8 as categories split

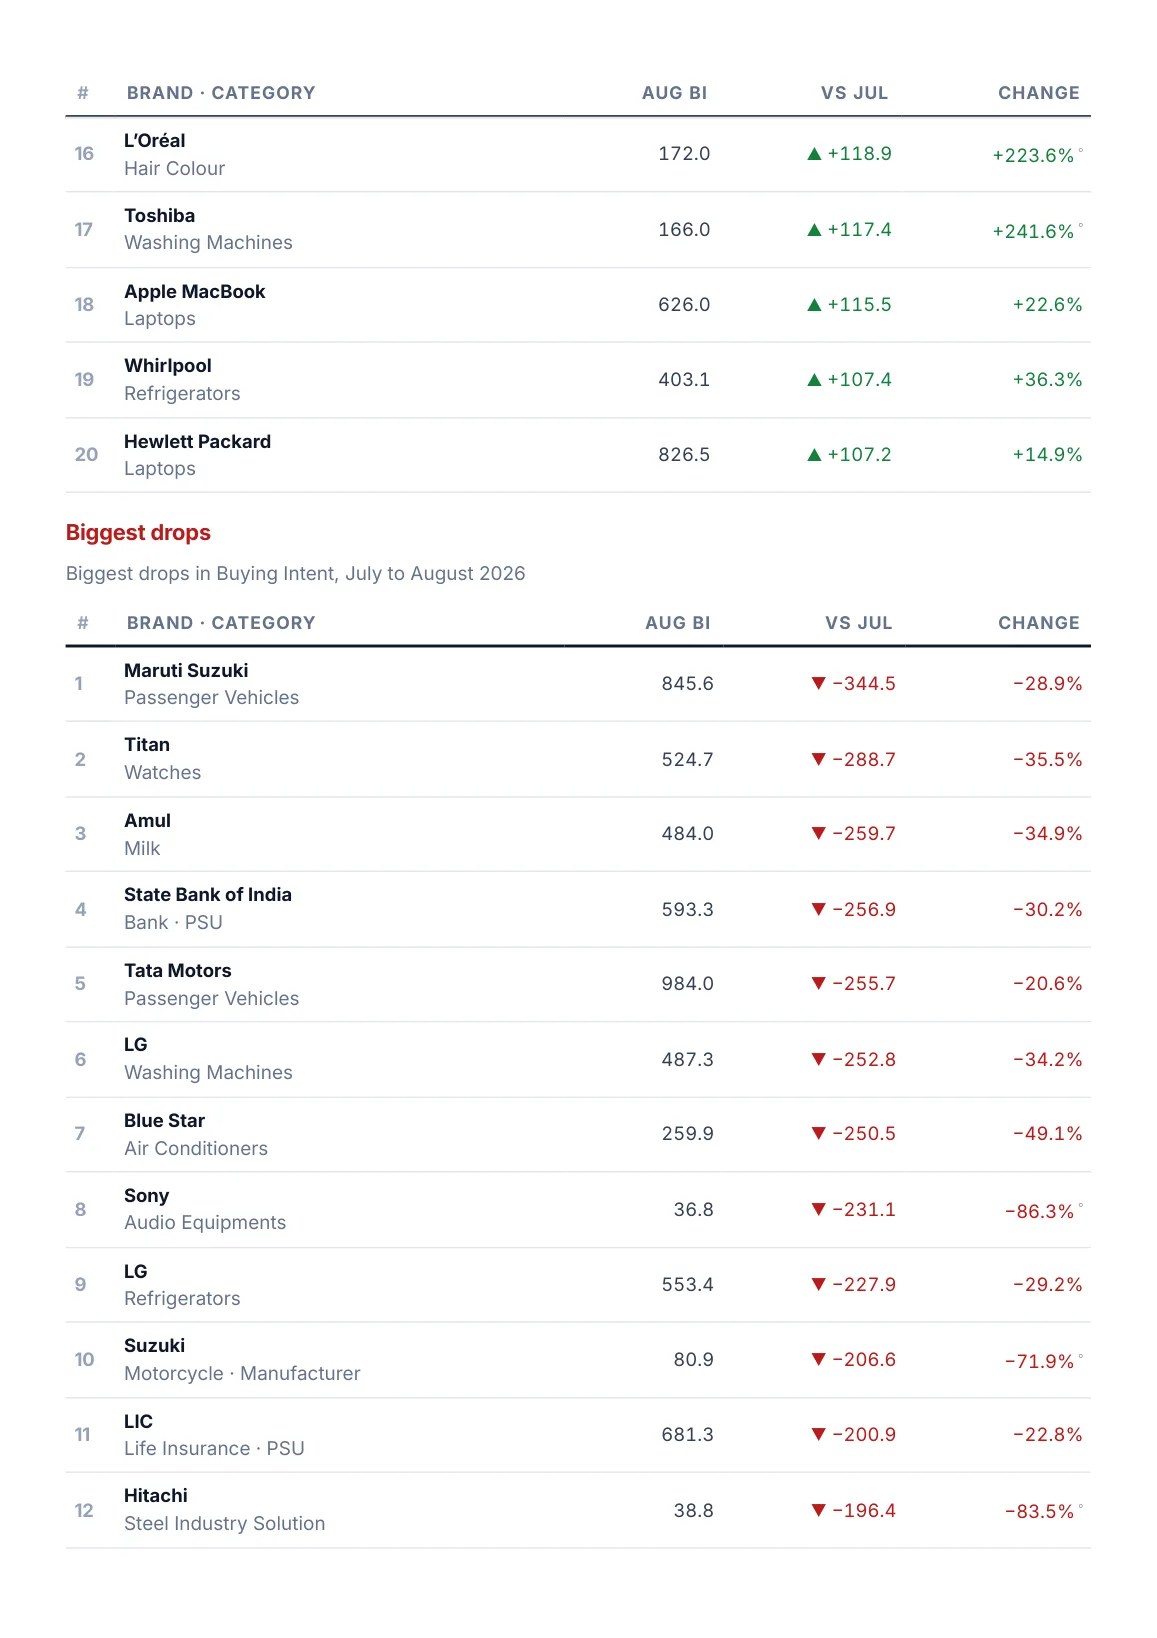
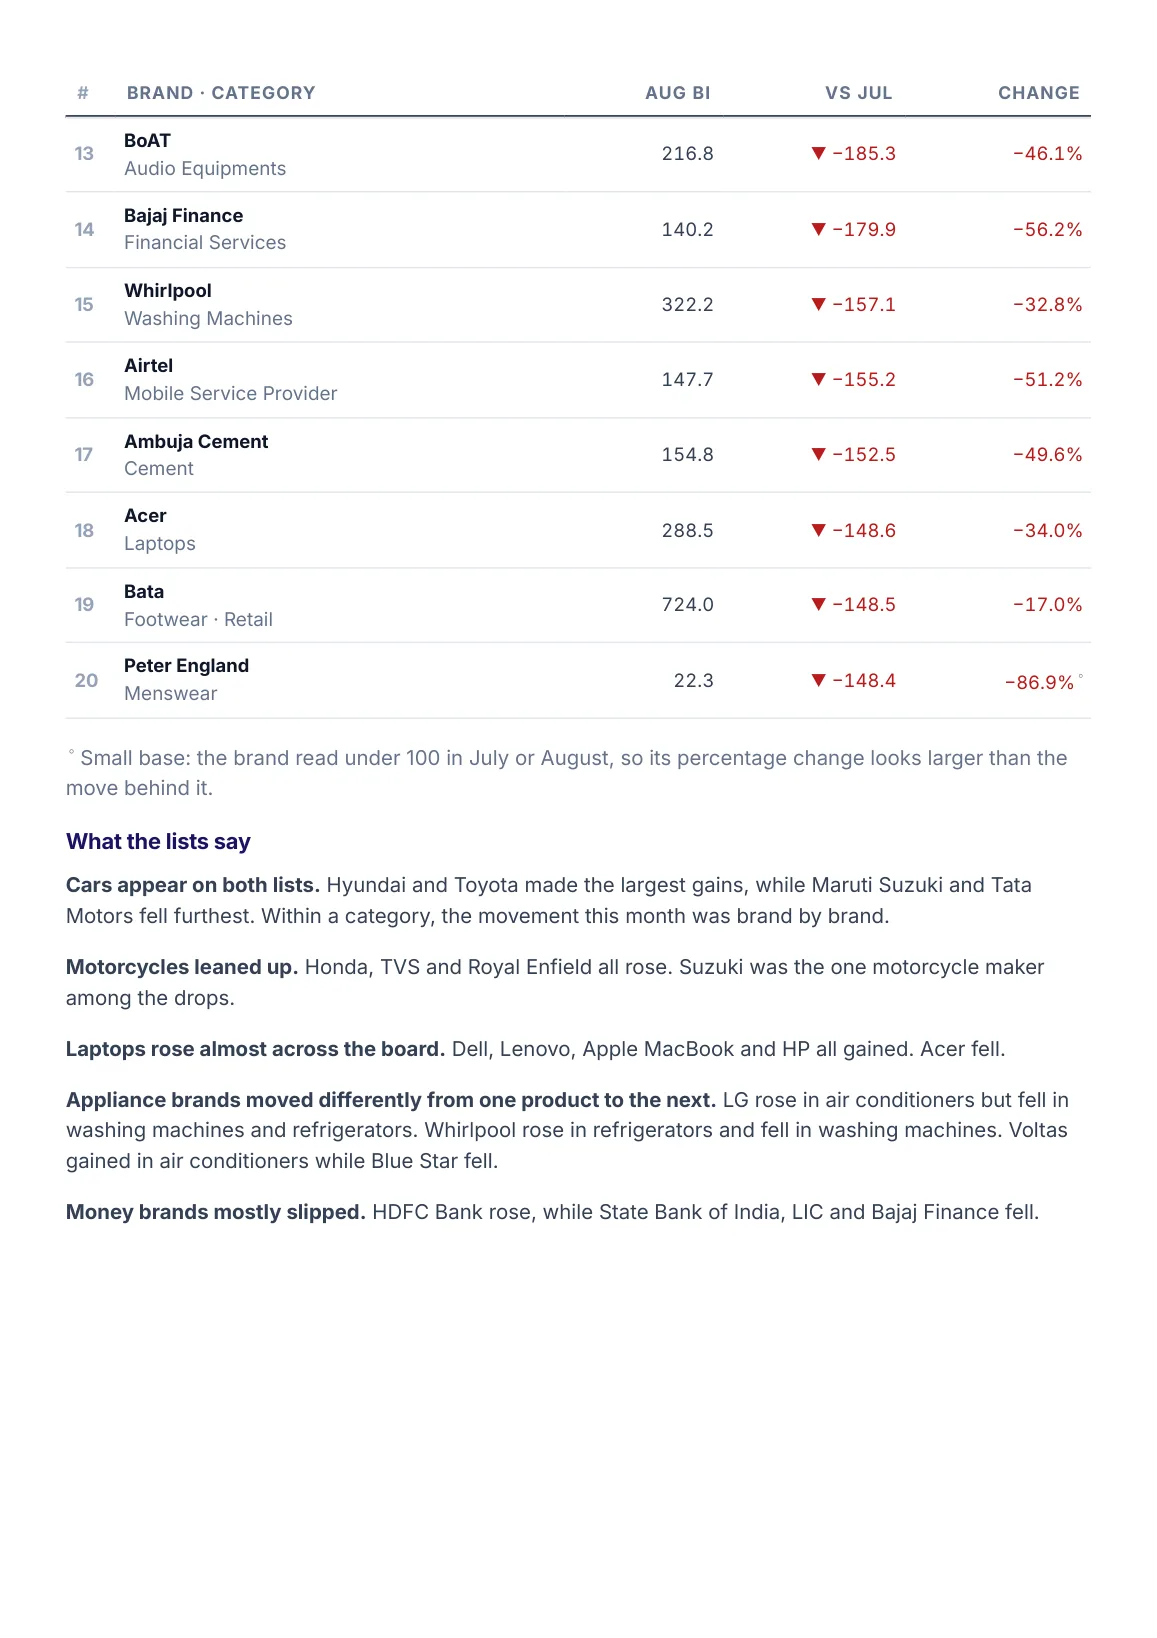
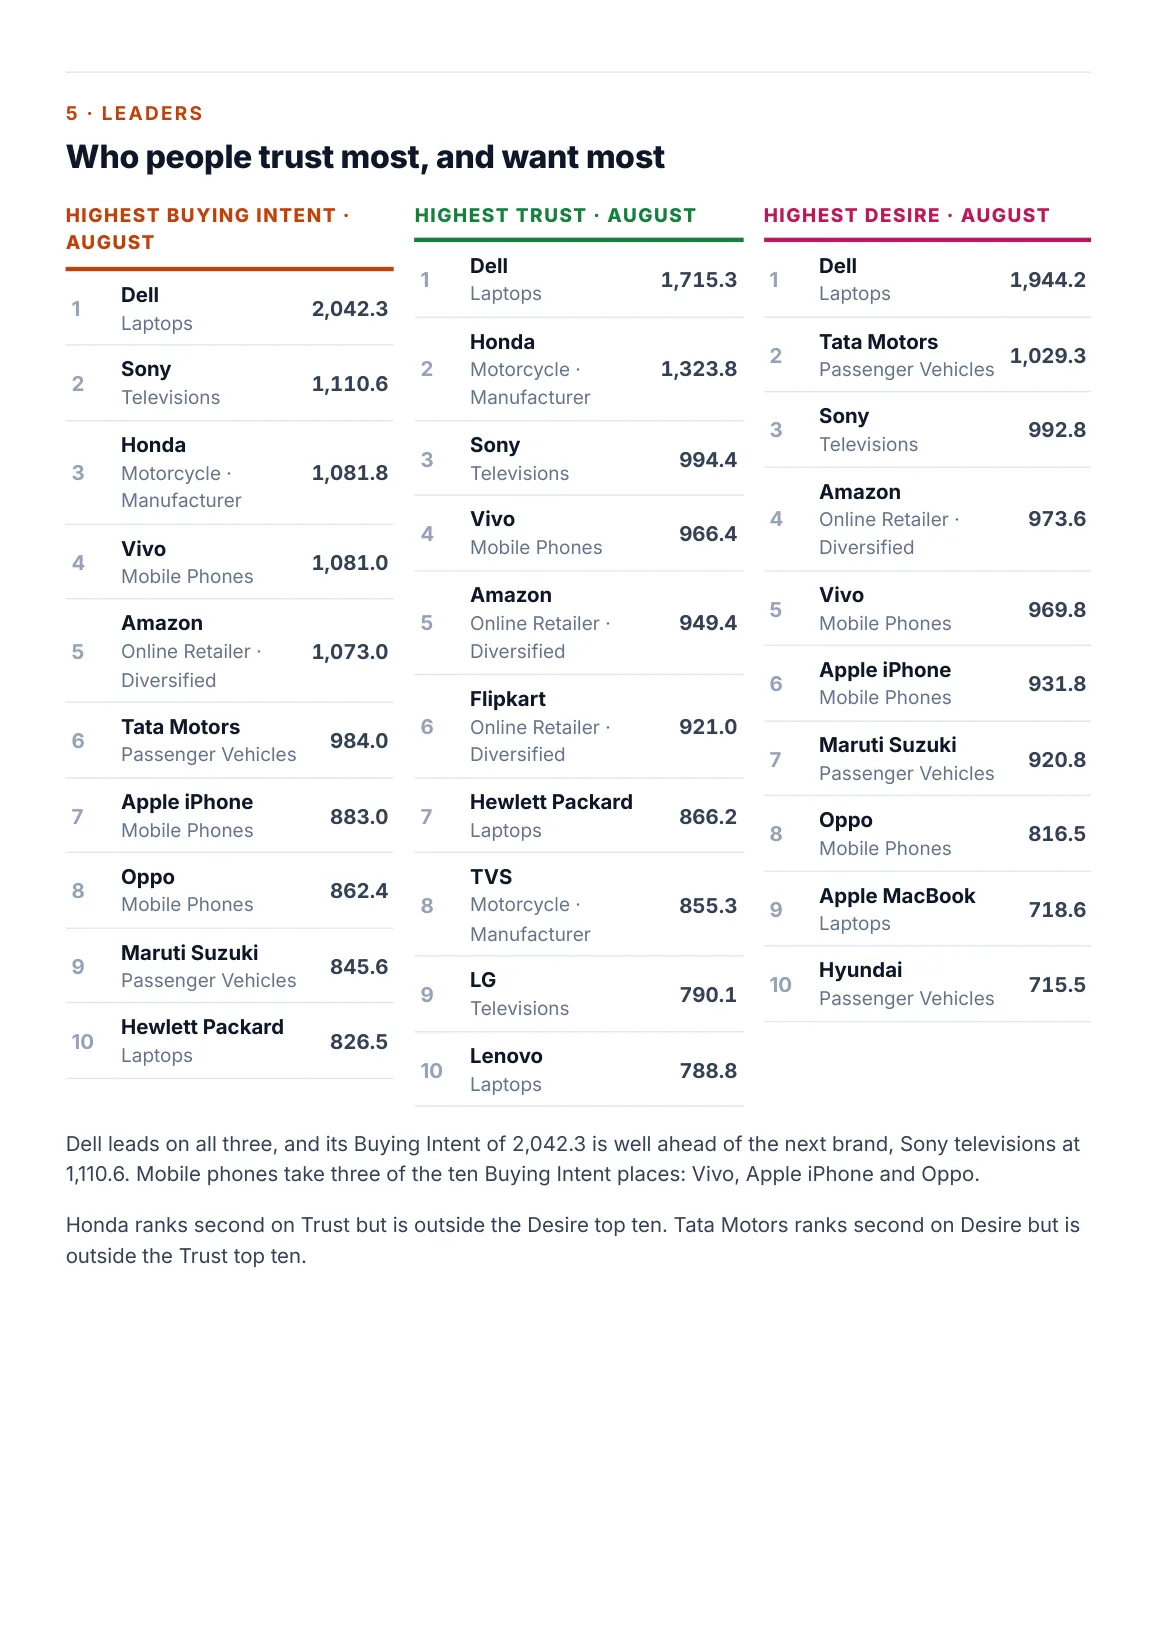
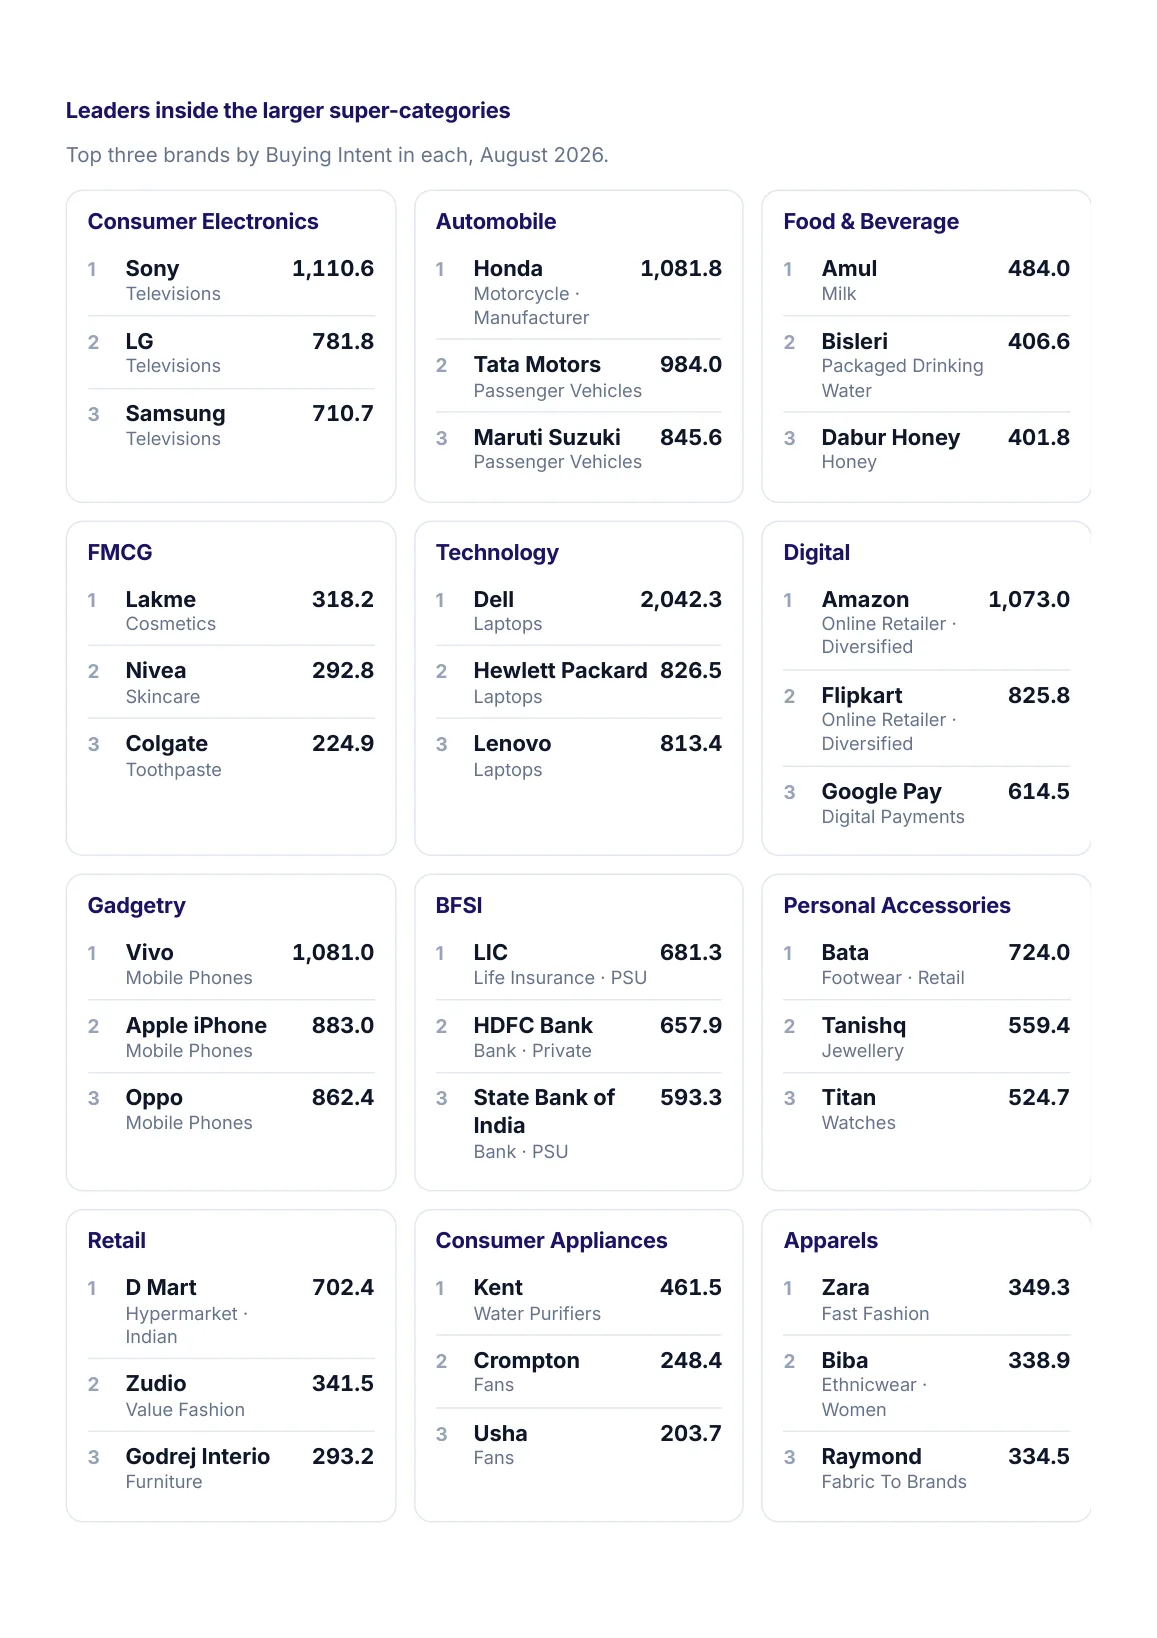
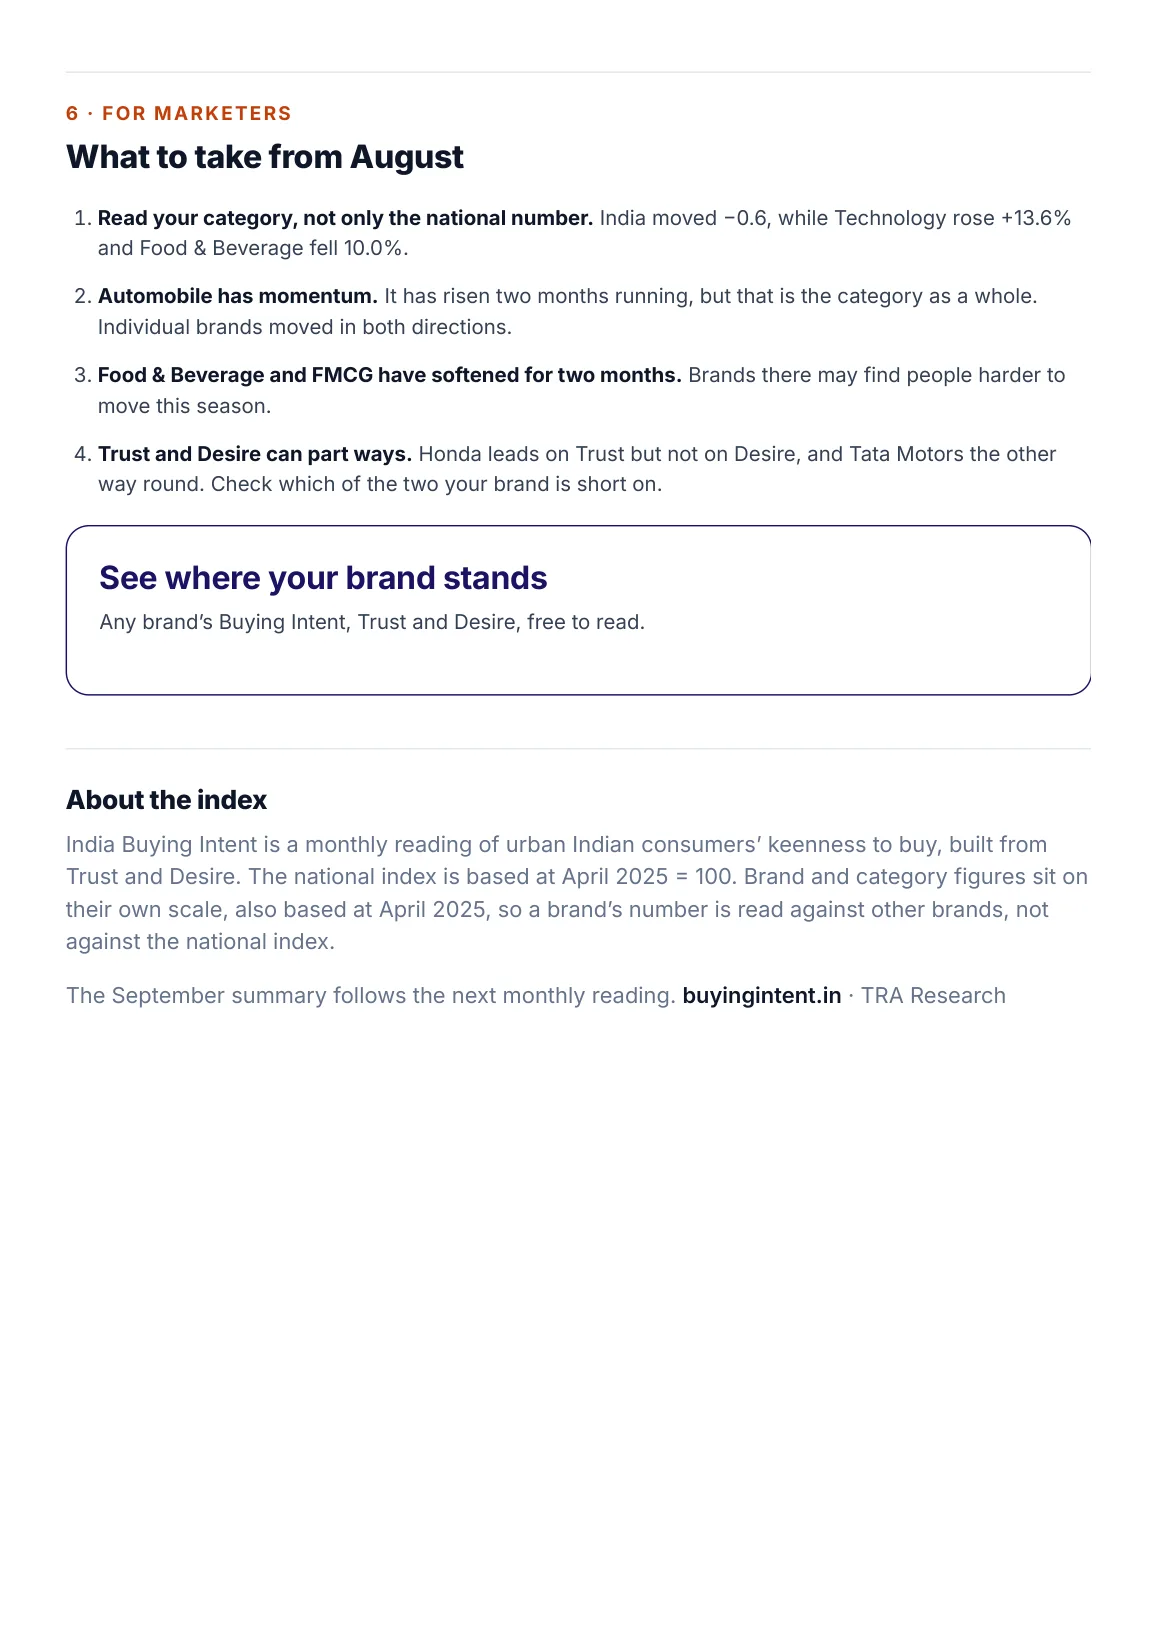
The monthly summary of the Buying Intent Index. The national reading dipped for a second month while Technology and Automobile strengthened and Food & Beverage and FMCG softened. It lists the twenty brands that moved most each way, who leads on Trust and Desire, and the leading brands inside the larger super-categories.

Monthly summary · Aug ’26
Published 23 Sep ’26 · 10 pages · Buying Intent measures keenness to buy; it does not measure transactions.
See contents · 10 pages
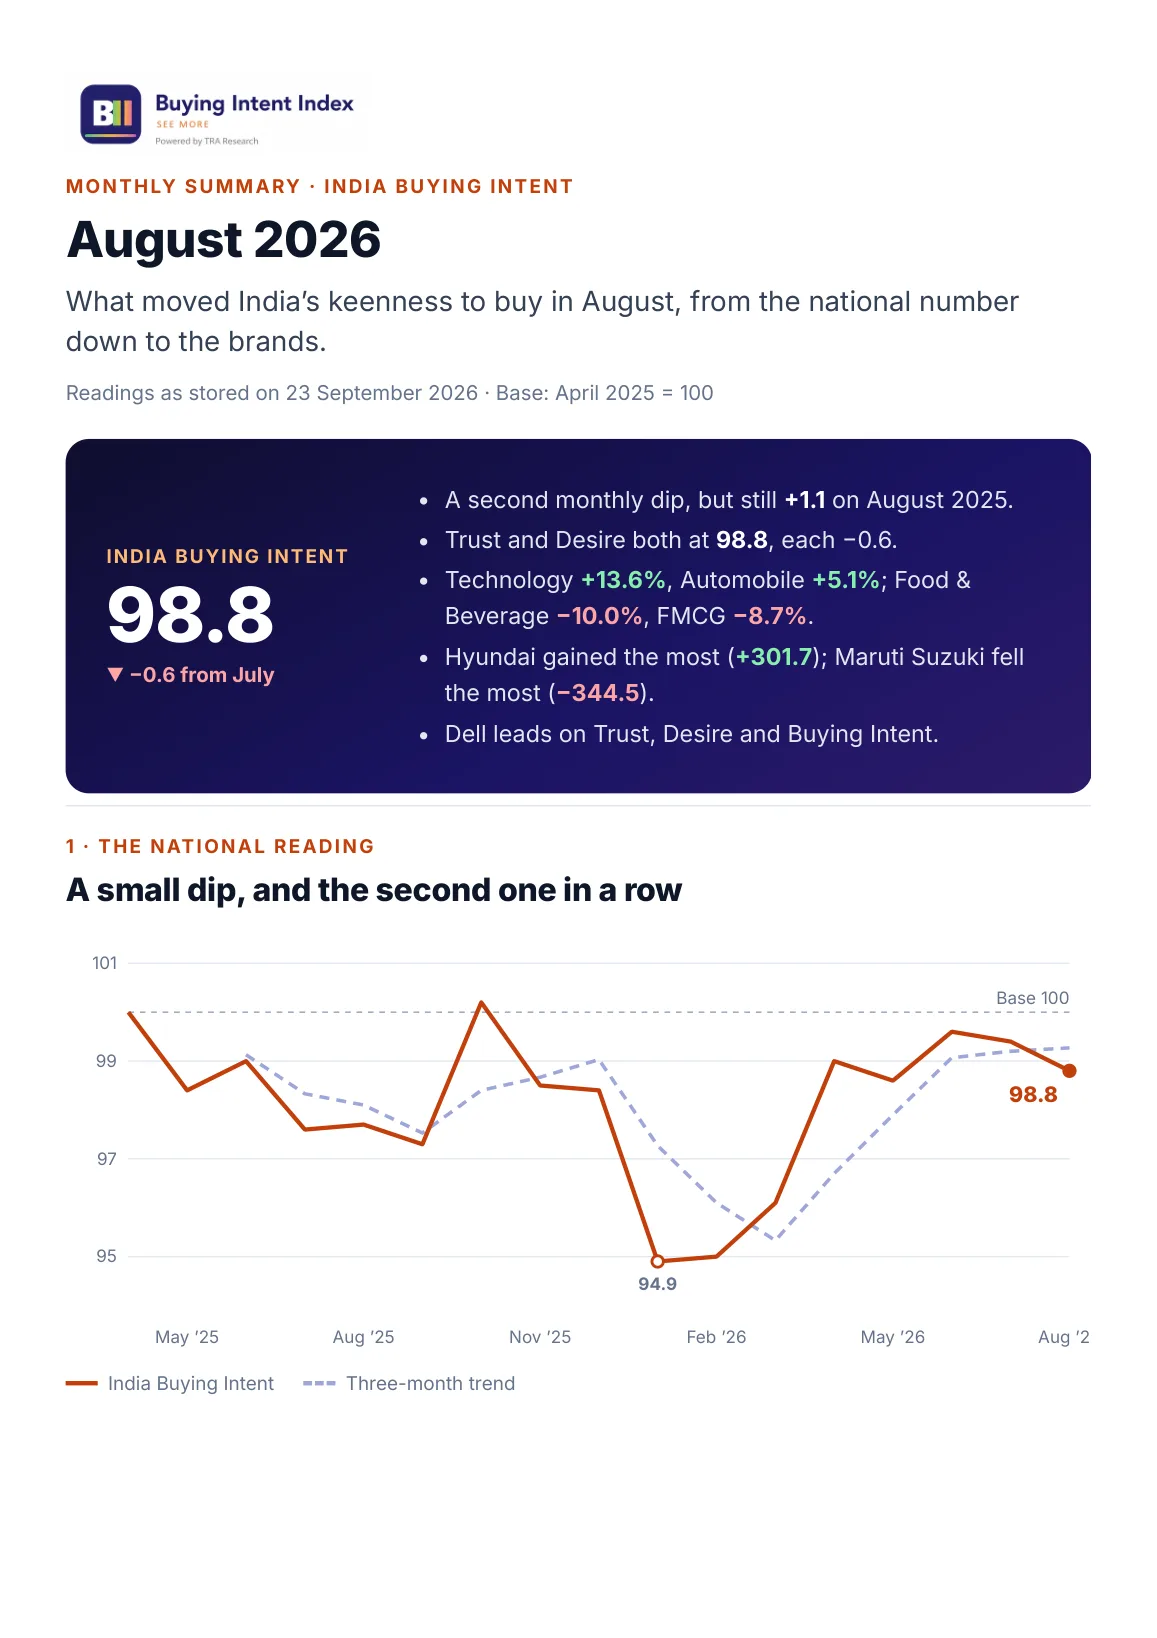
Page 1: August at a glance, India Buying Intent at 98.8 and the 17-month national chart
Page 1 of 10
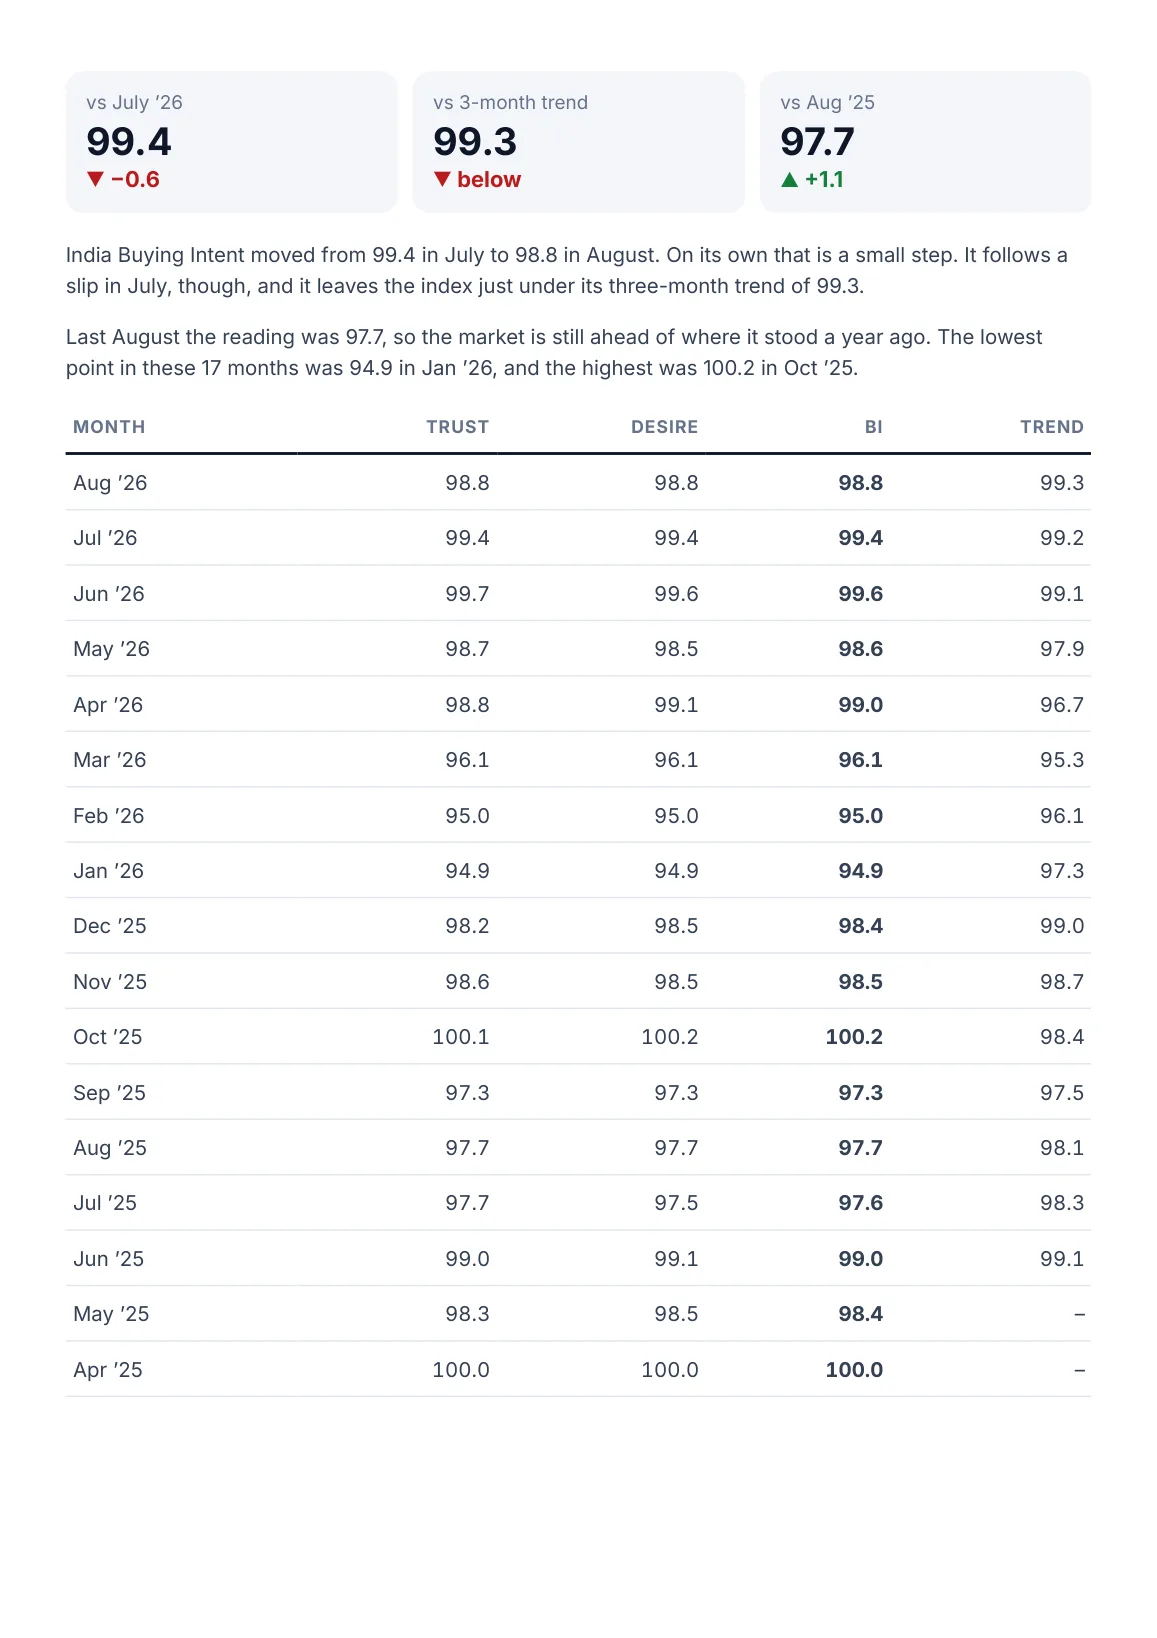
Page 2: comparison with July, the three-month trend and Aug ’25, and all 17 monthly readings
Page 2 of 10
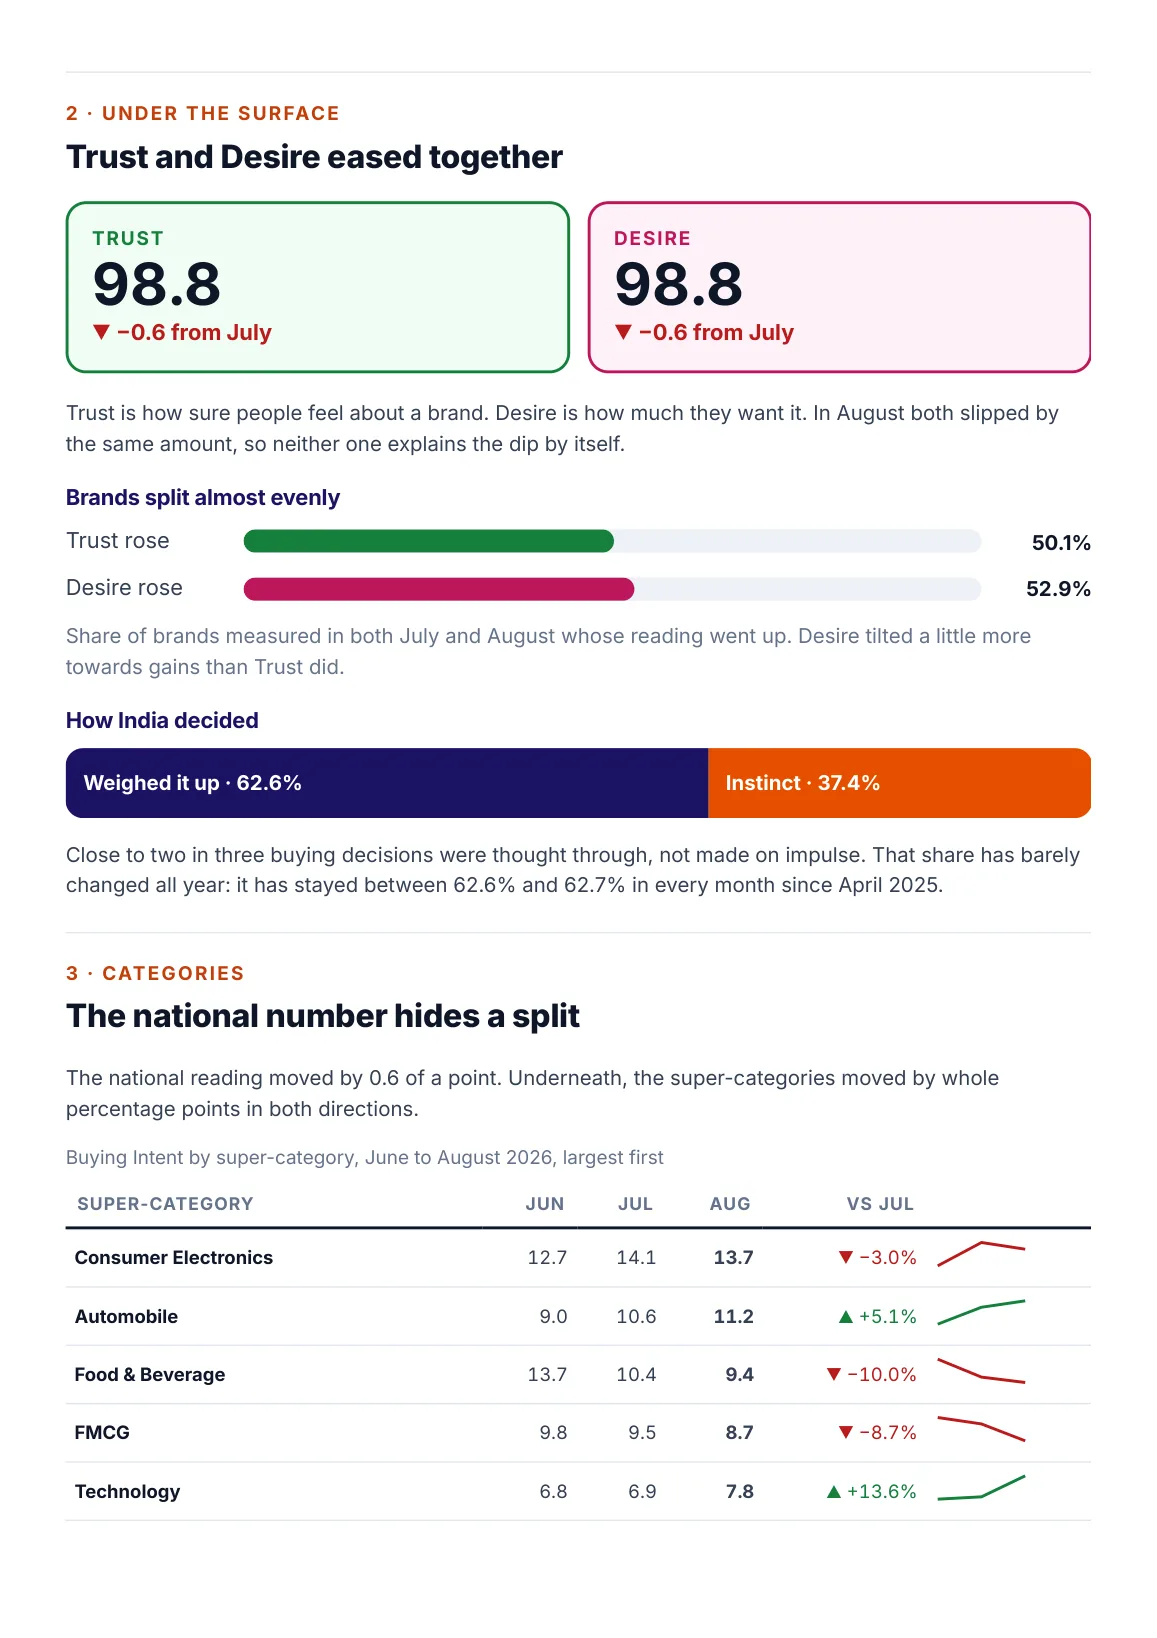
Page 3: Trust and Desire, how brands split, how India decided, and the larger super-categories
Page 3 of 10
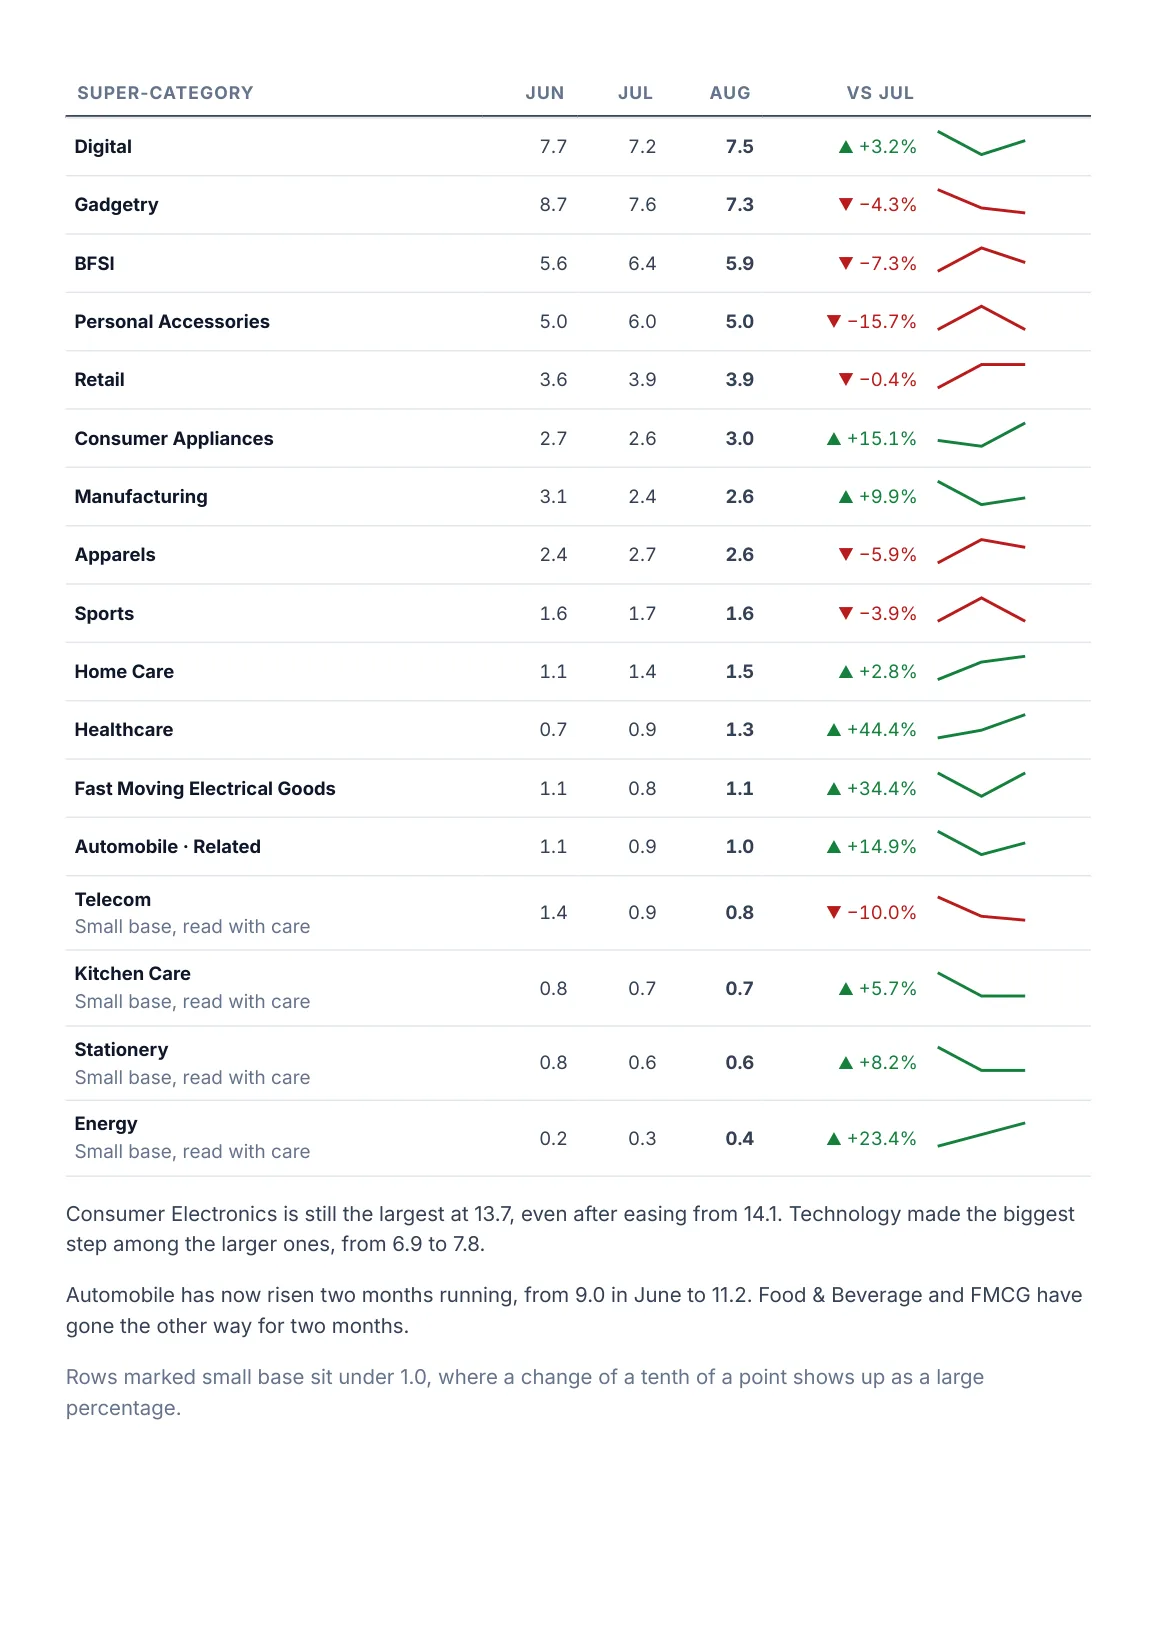
Page 4: every super-category, June to Aug ’26, with the category commentary
Page 4 of 10
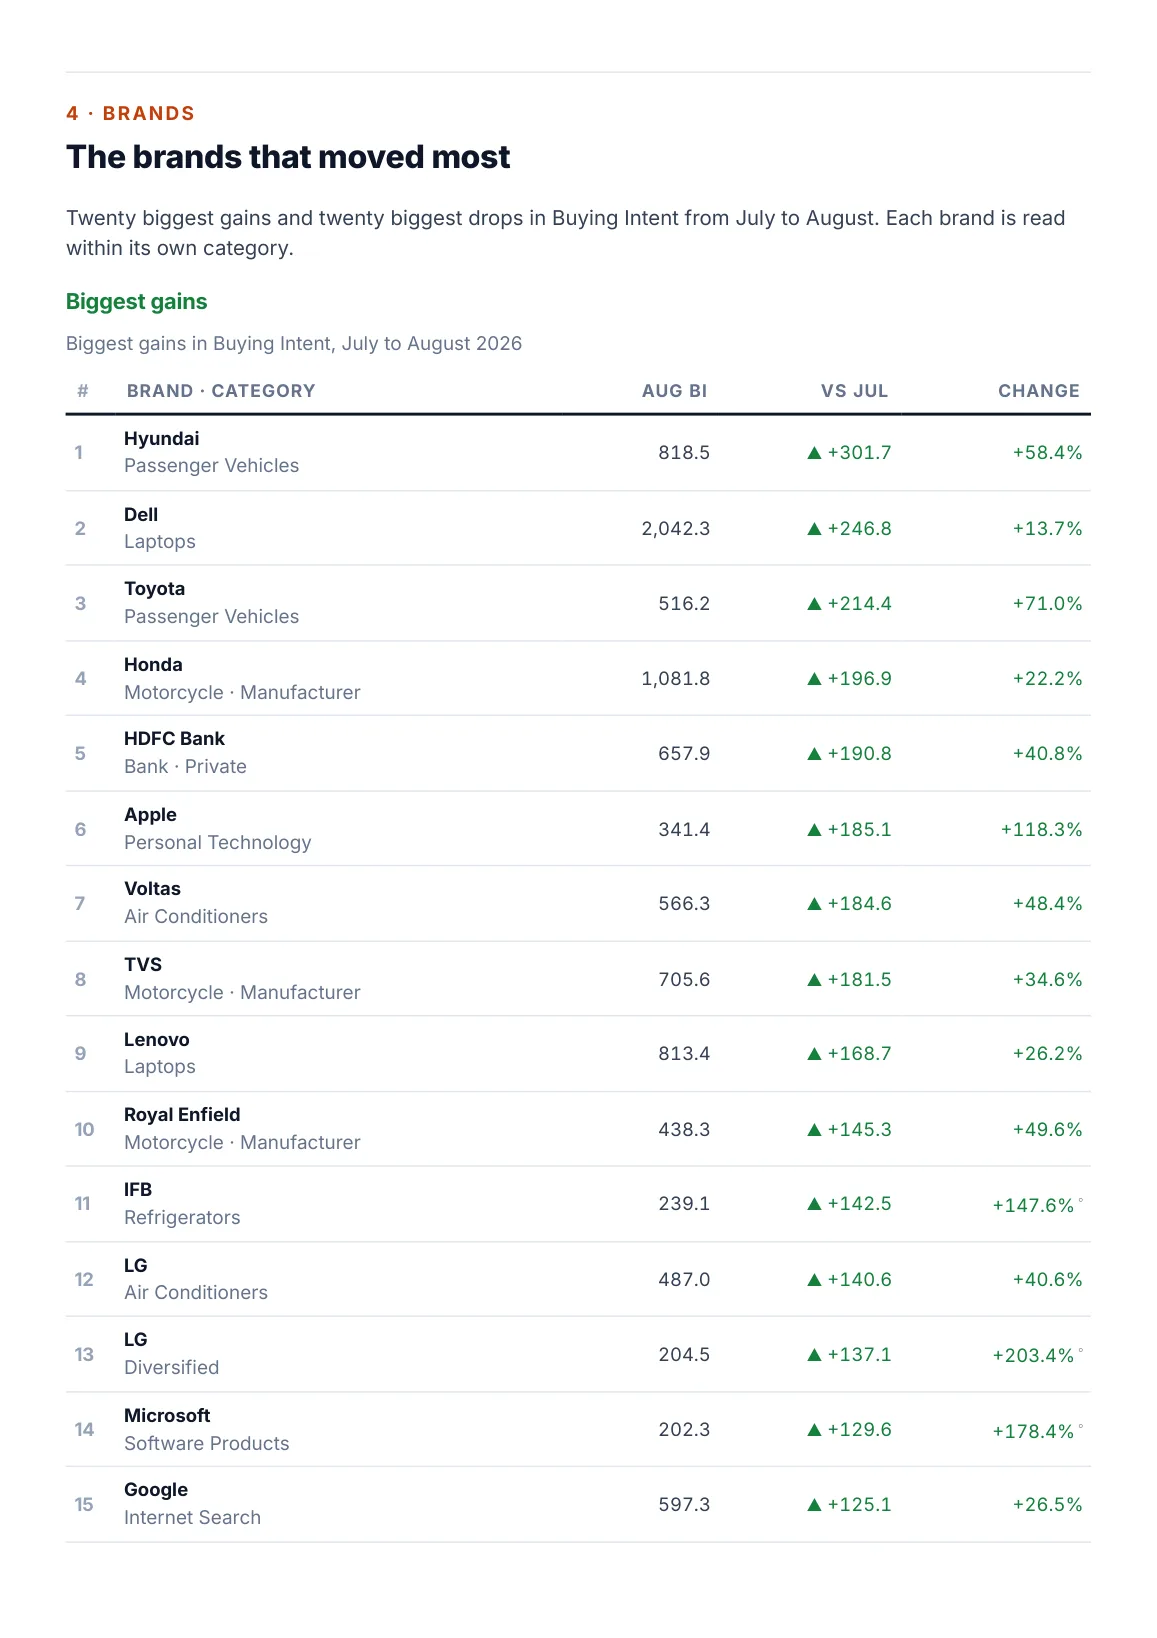
Page 5: the twenty biggest brand gains in Buying Intent
Page 5 of 10
Page 6: the twenty biggest brand drops in Buying Intent
Page 6 of 10
Page 7: what the brand lists say
Page 7 of 10
Page 8: highest Buying Intent, Trust and Desire in August
Page 8 of 10
Page 9: the leading brands inside twelve larger super-categories
Page 9 of 10
Page 10: what to take from August, and about the index
Page 10 of 10

Source: Buying Intent Index, BuyingIntent.in, by TRA Research.