BII Reports

Published reports from the Buying Intent Index

Category and market readings built on stored Buying Intent, Trust and Desire figures. Each report is free to read here and to download.

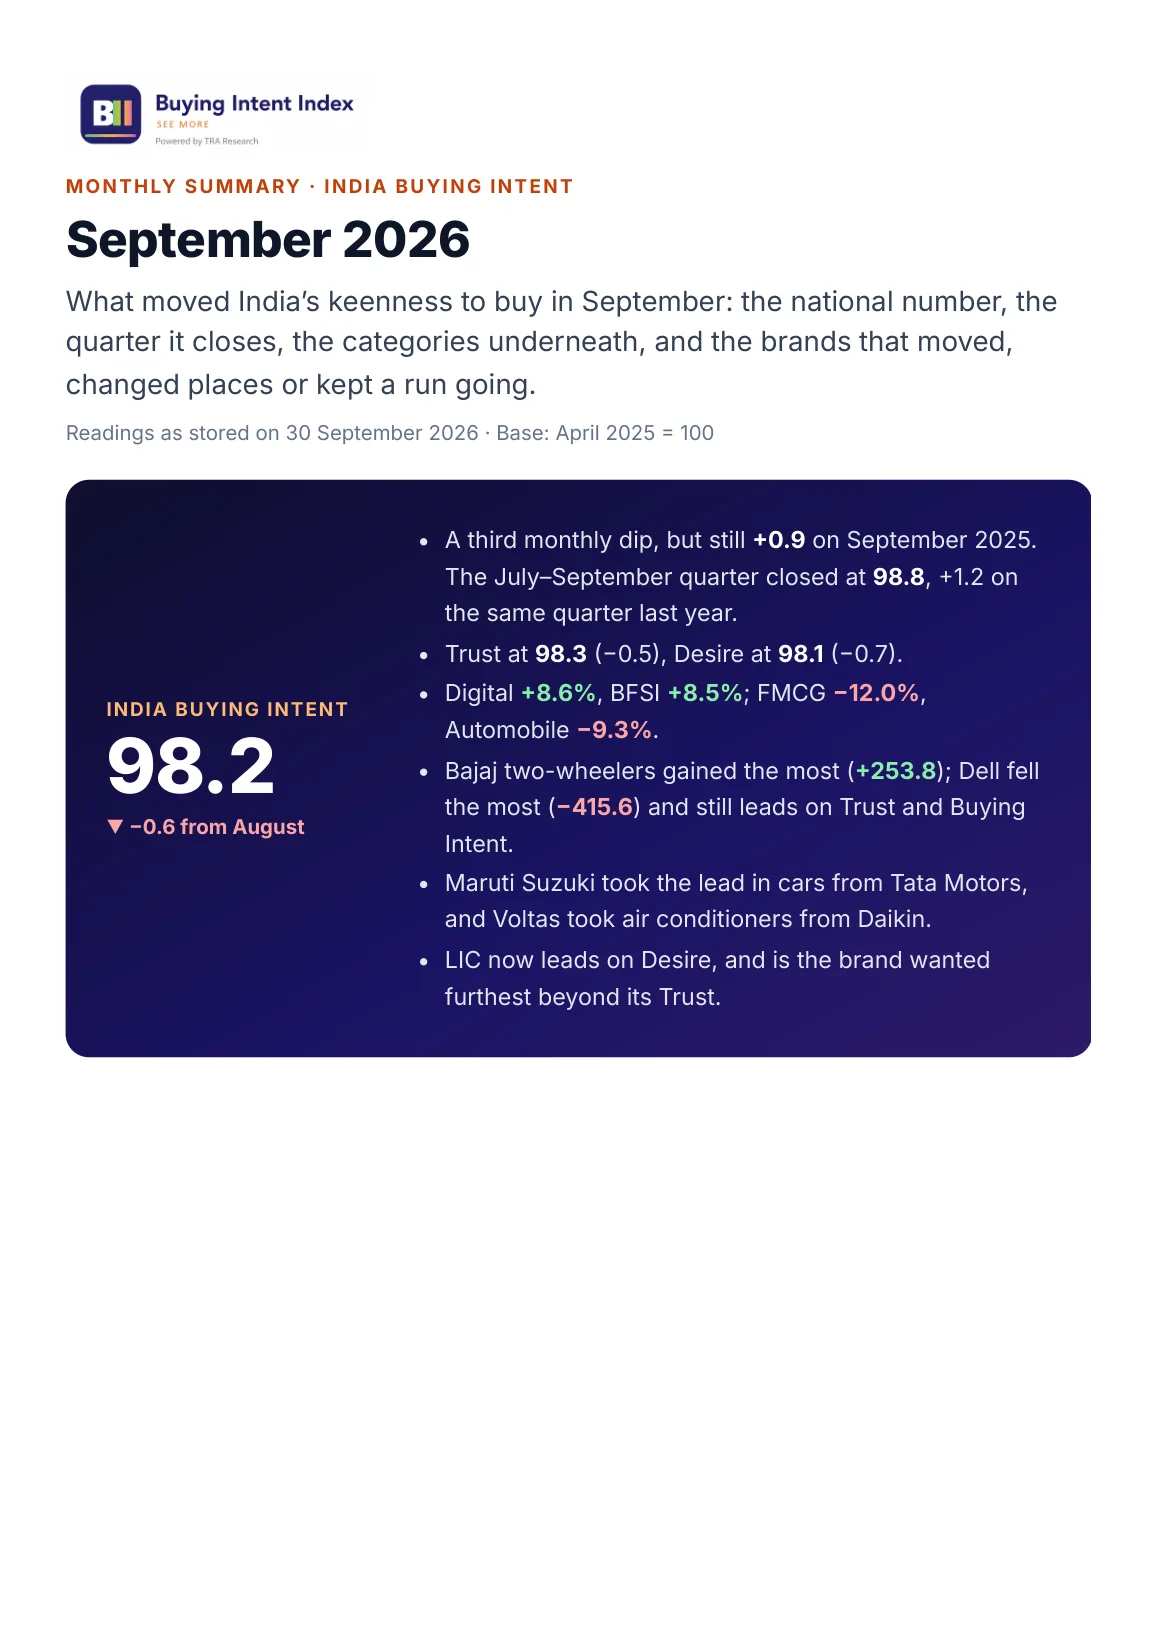
Page 1: September at a glance, India Buying Intent at 98.2, and the 18-month national chart
Page 1 of 20
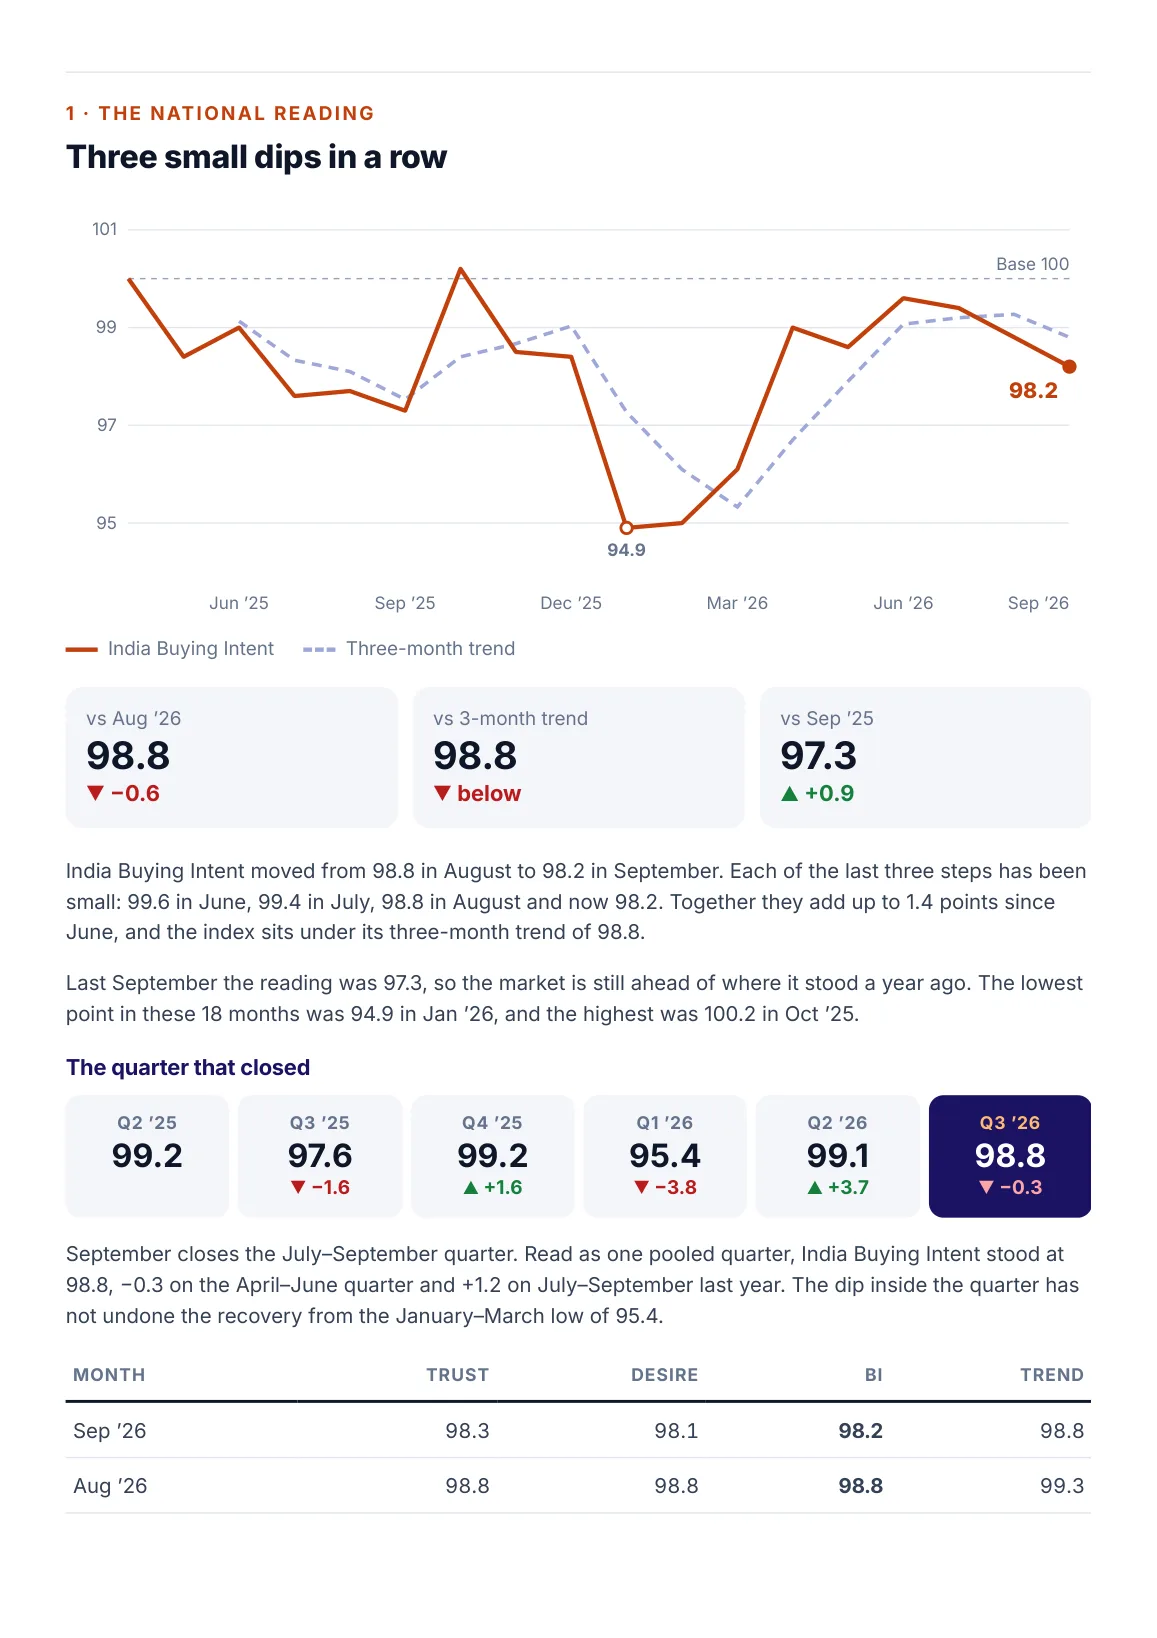
Page 2: the national reading against August, the three-month trend and September 2025, and the quarter that closed
Page 2 of 20
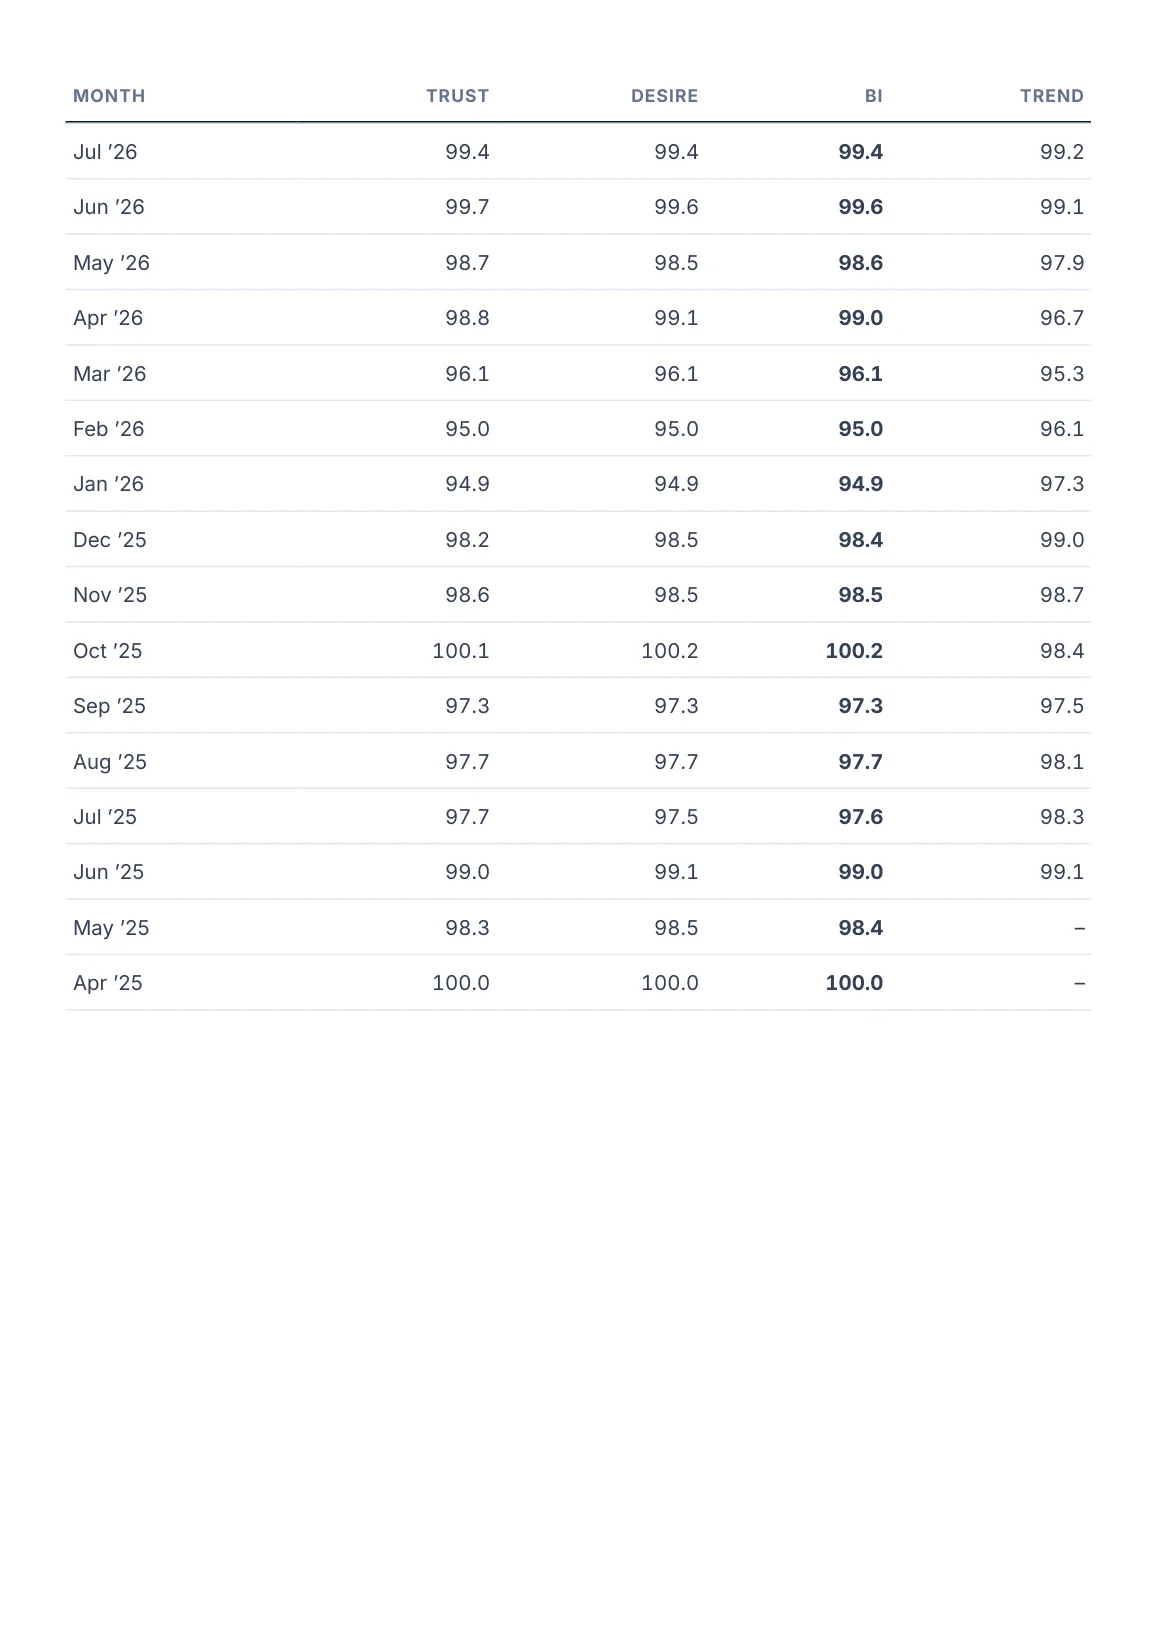
Page 3: all 18 monthly readings
Page 3 of 20
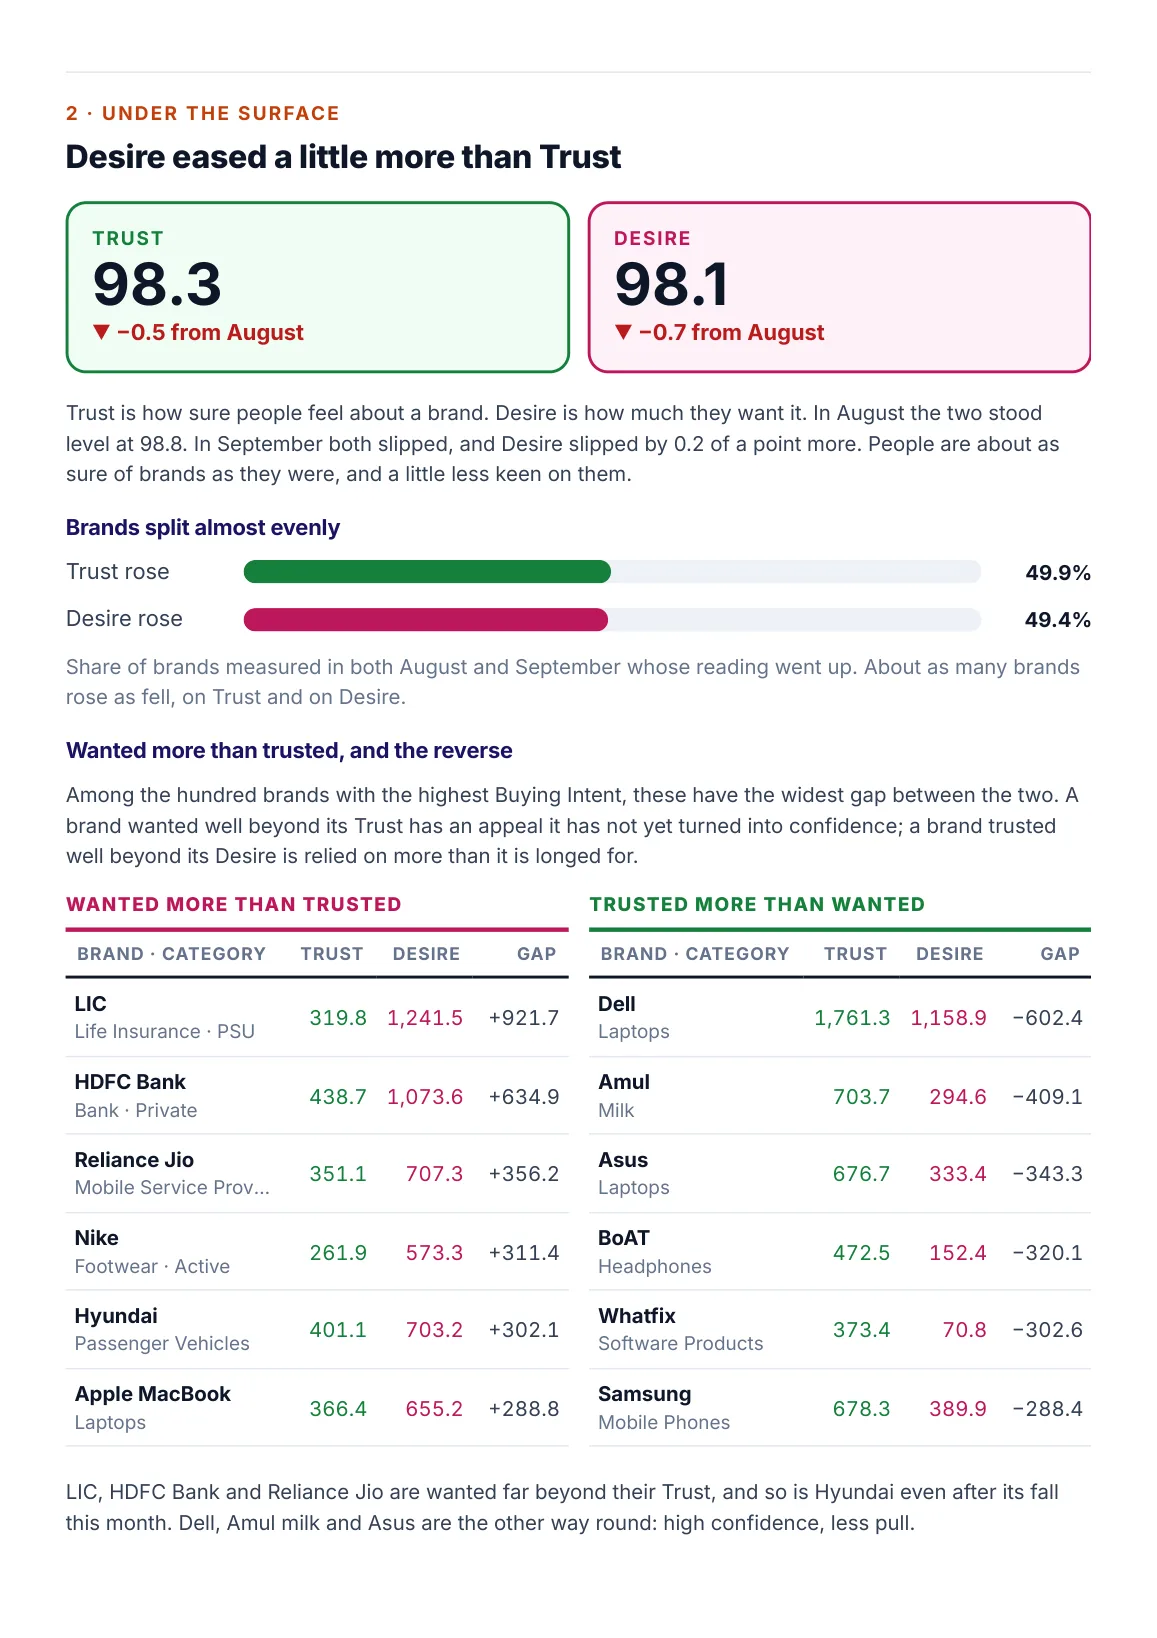
Page 4: Trust and Desire, how brands split, and the brands wanted more than trusted or trusted more than wanted
Page 4 of 20
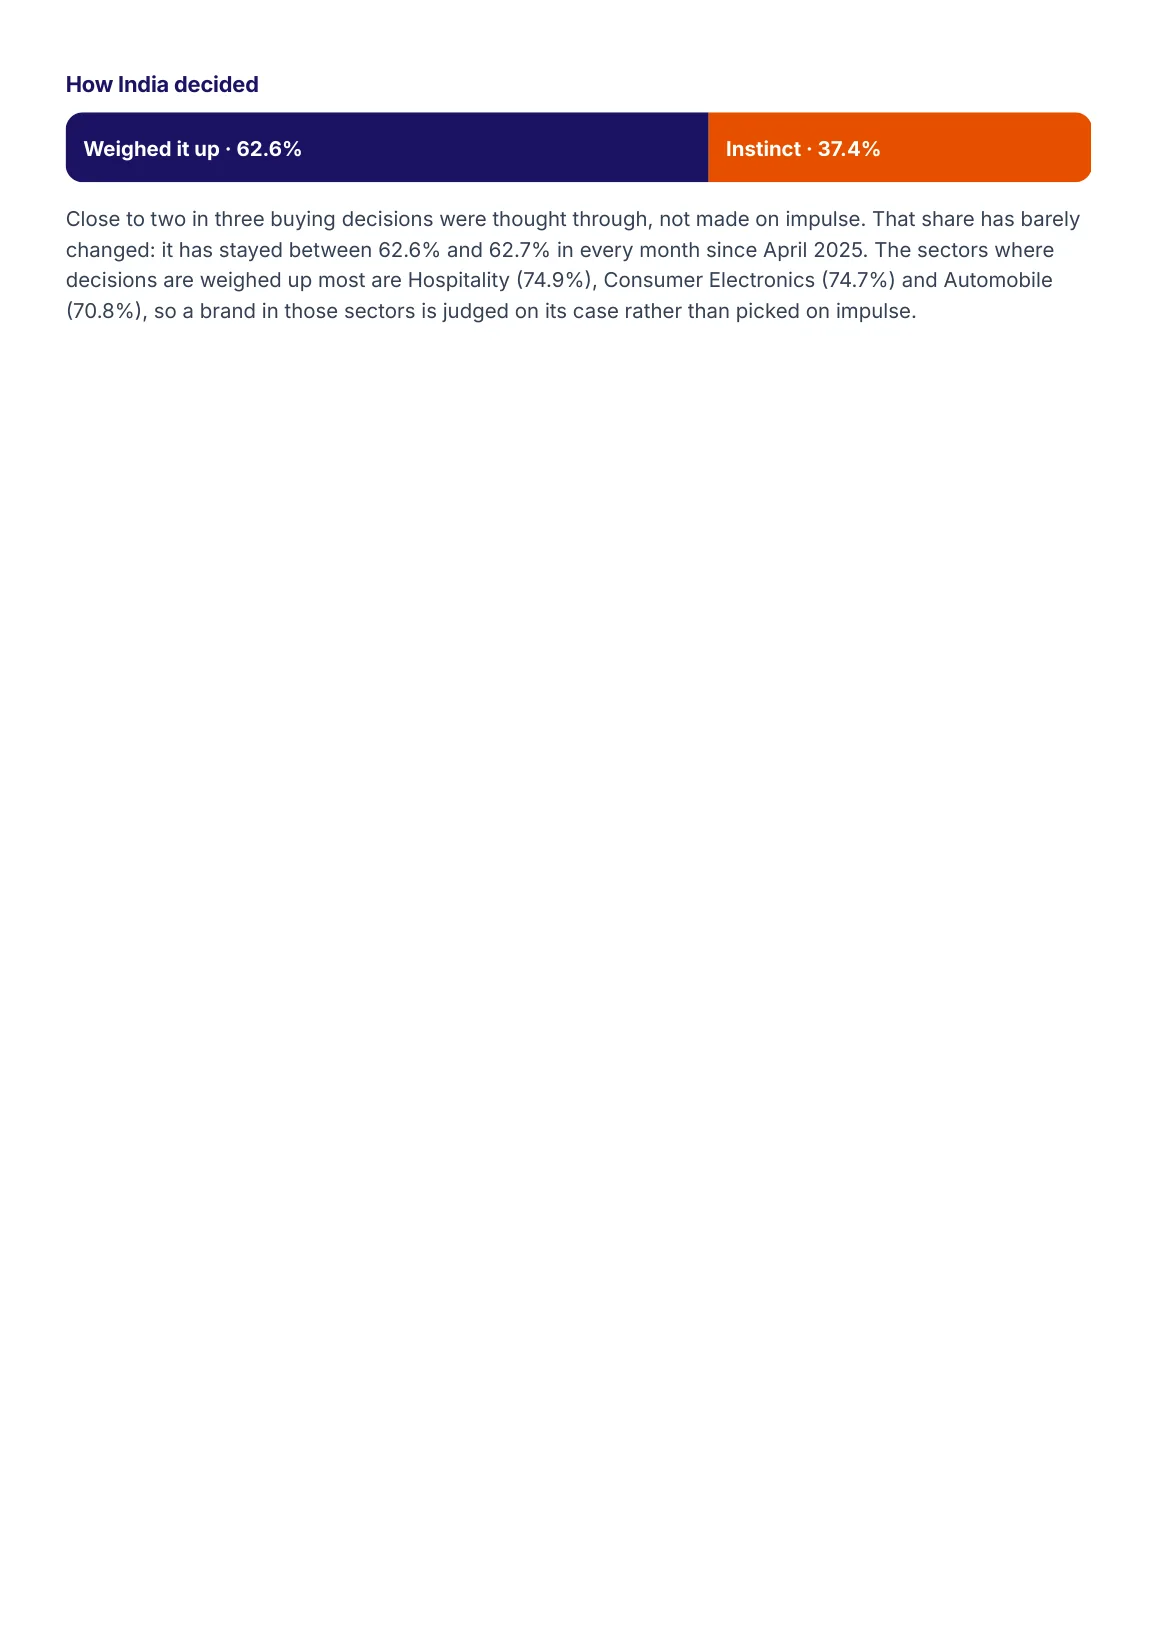
Page 5: how India decided, and the sectors where decisions are weighed up most
Page 5 of 20
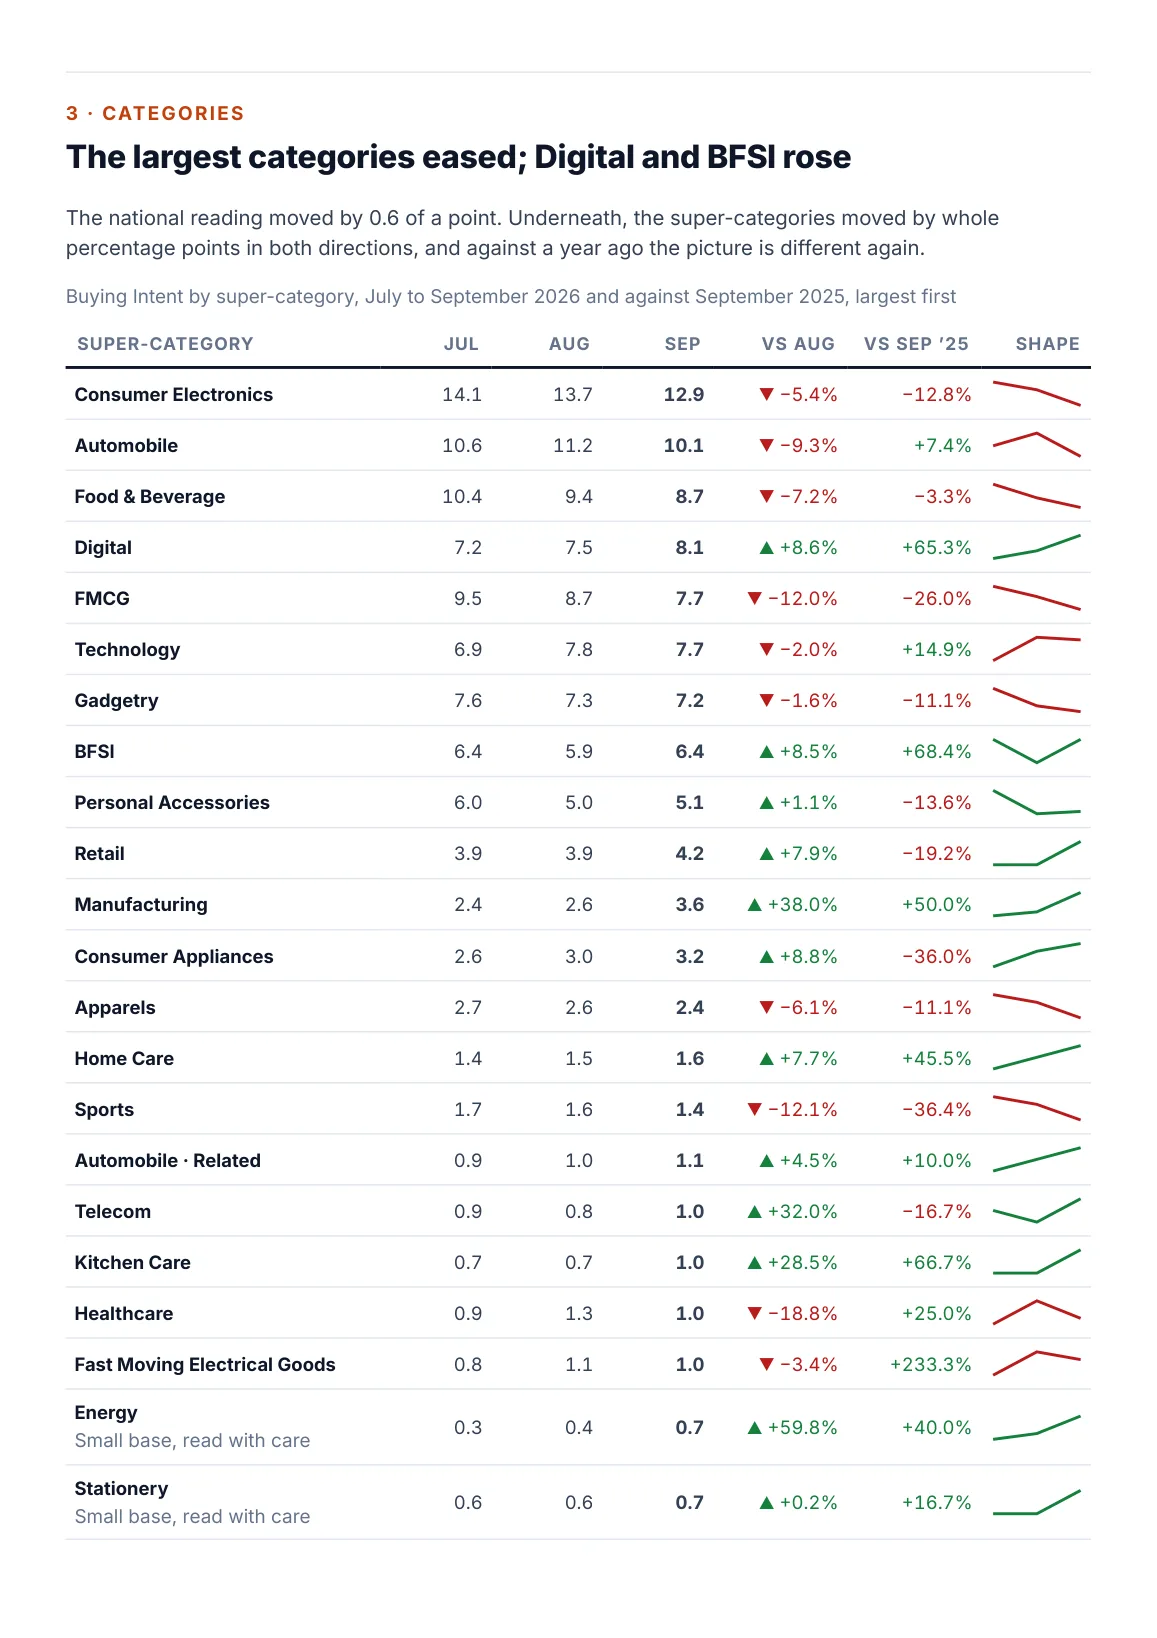
Page 6: every super-category, July to September 2026 and against September 2025
Page 6 of 20
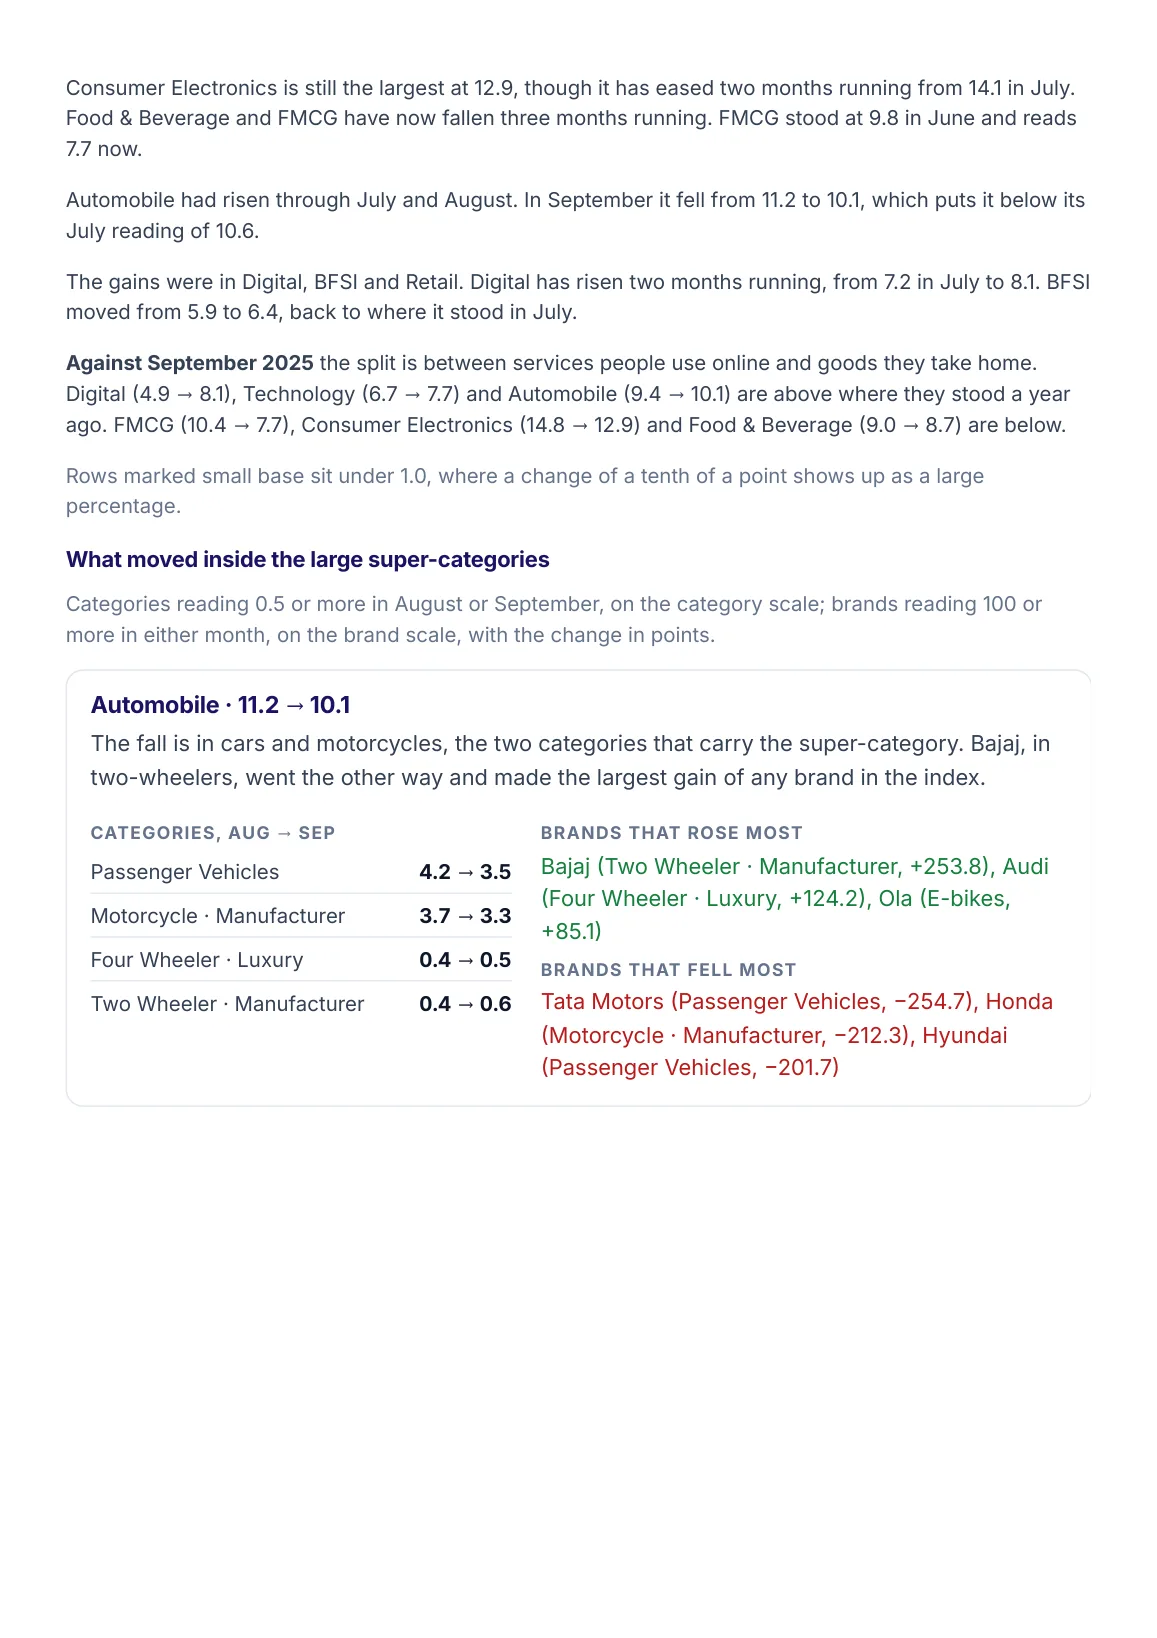
Page 7: the category commentary, and what moved inside Automobile
Page 7 of 20
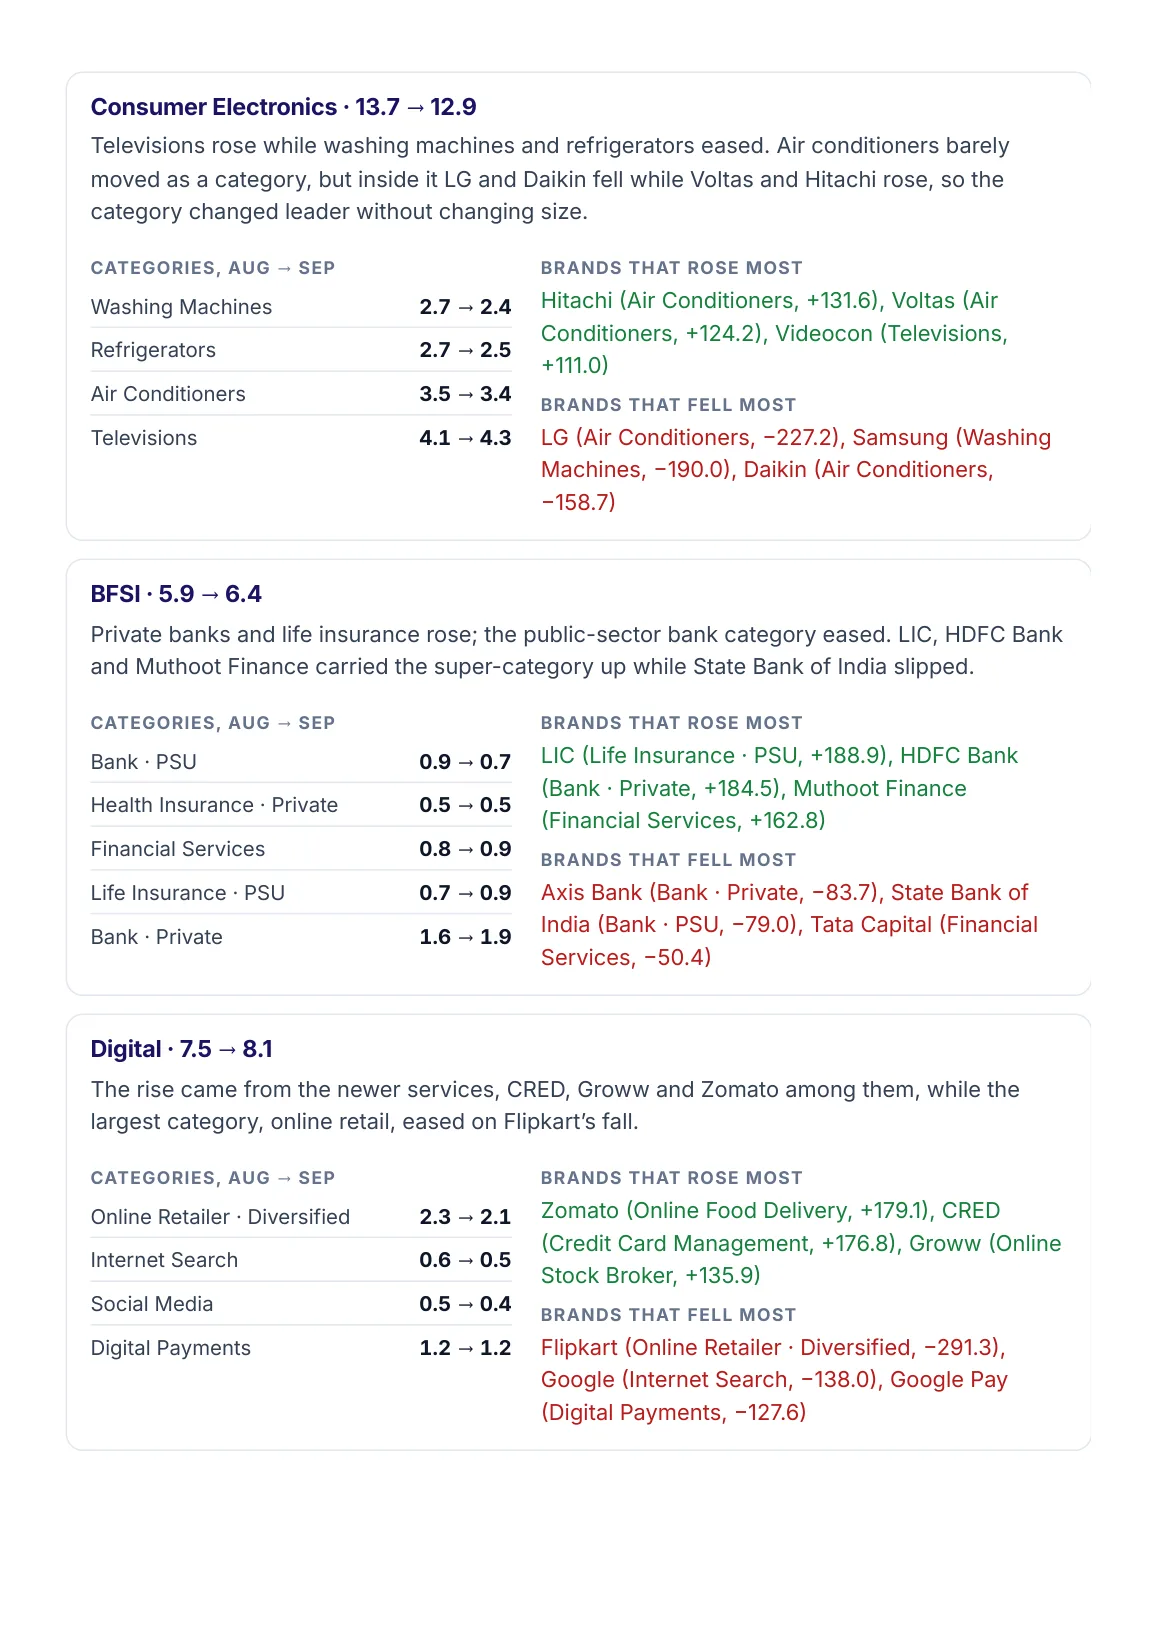
Page 8: what moved inside Consumer Electronics, BFSI and Digital
Page 8 of 20
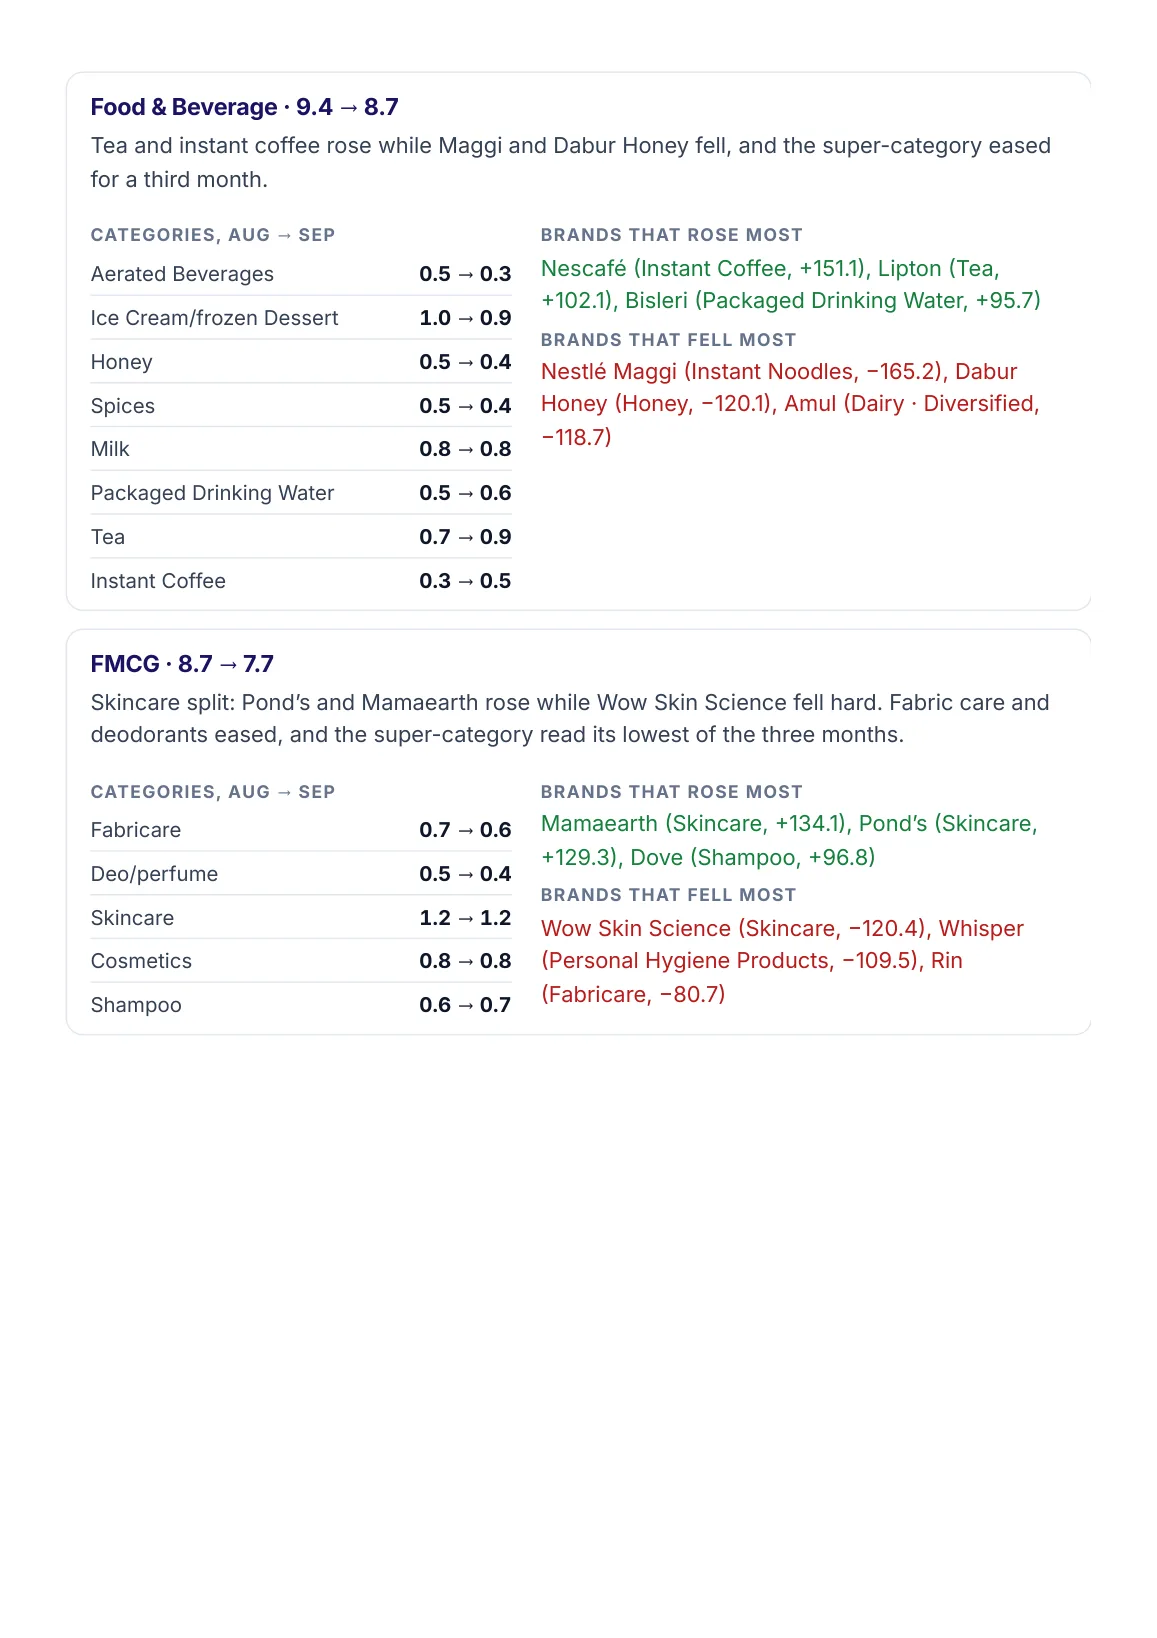
Page 9: what moved inside Food & Beverage and FMCG
Page 9 of 20
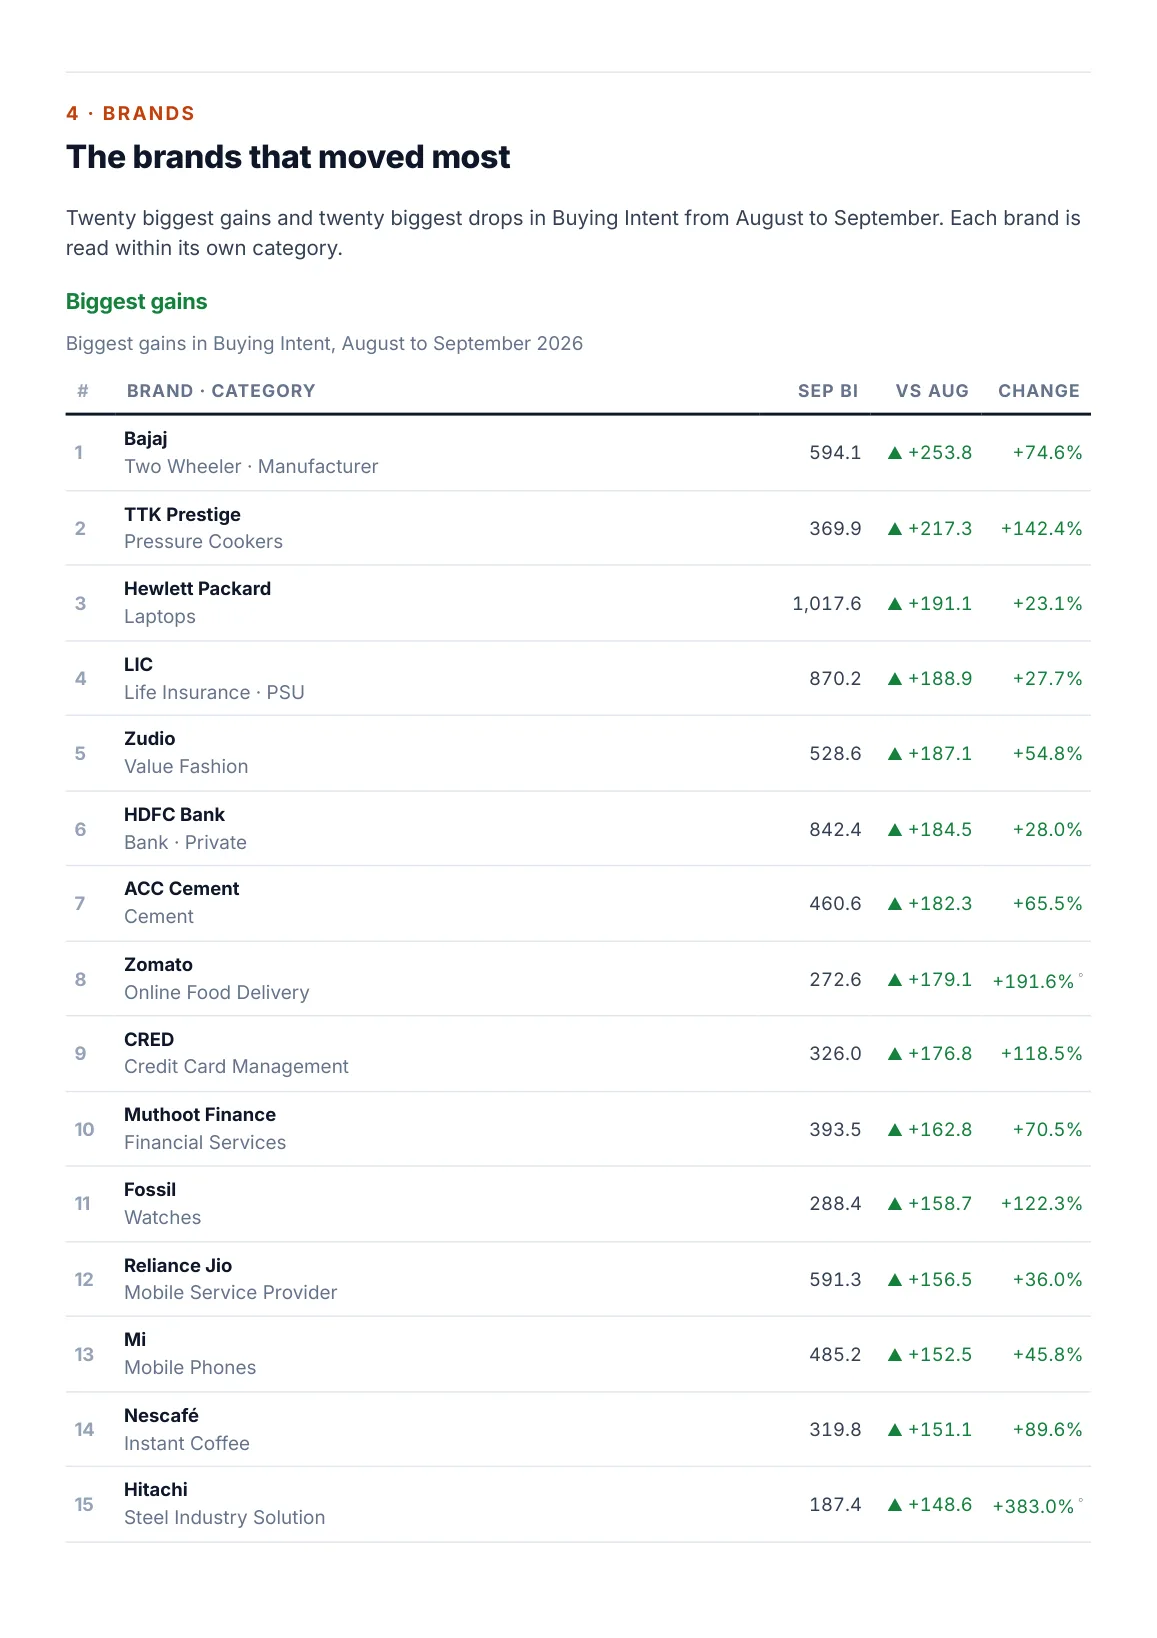
Page 10: the twenty biggest brand gains in Buying Intent, first part
Page 10 of 20
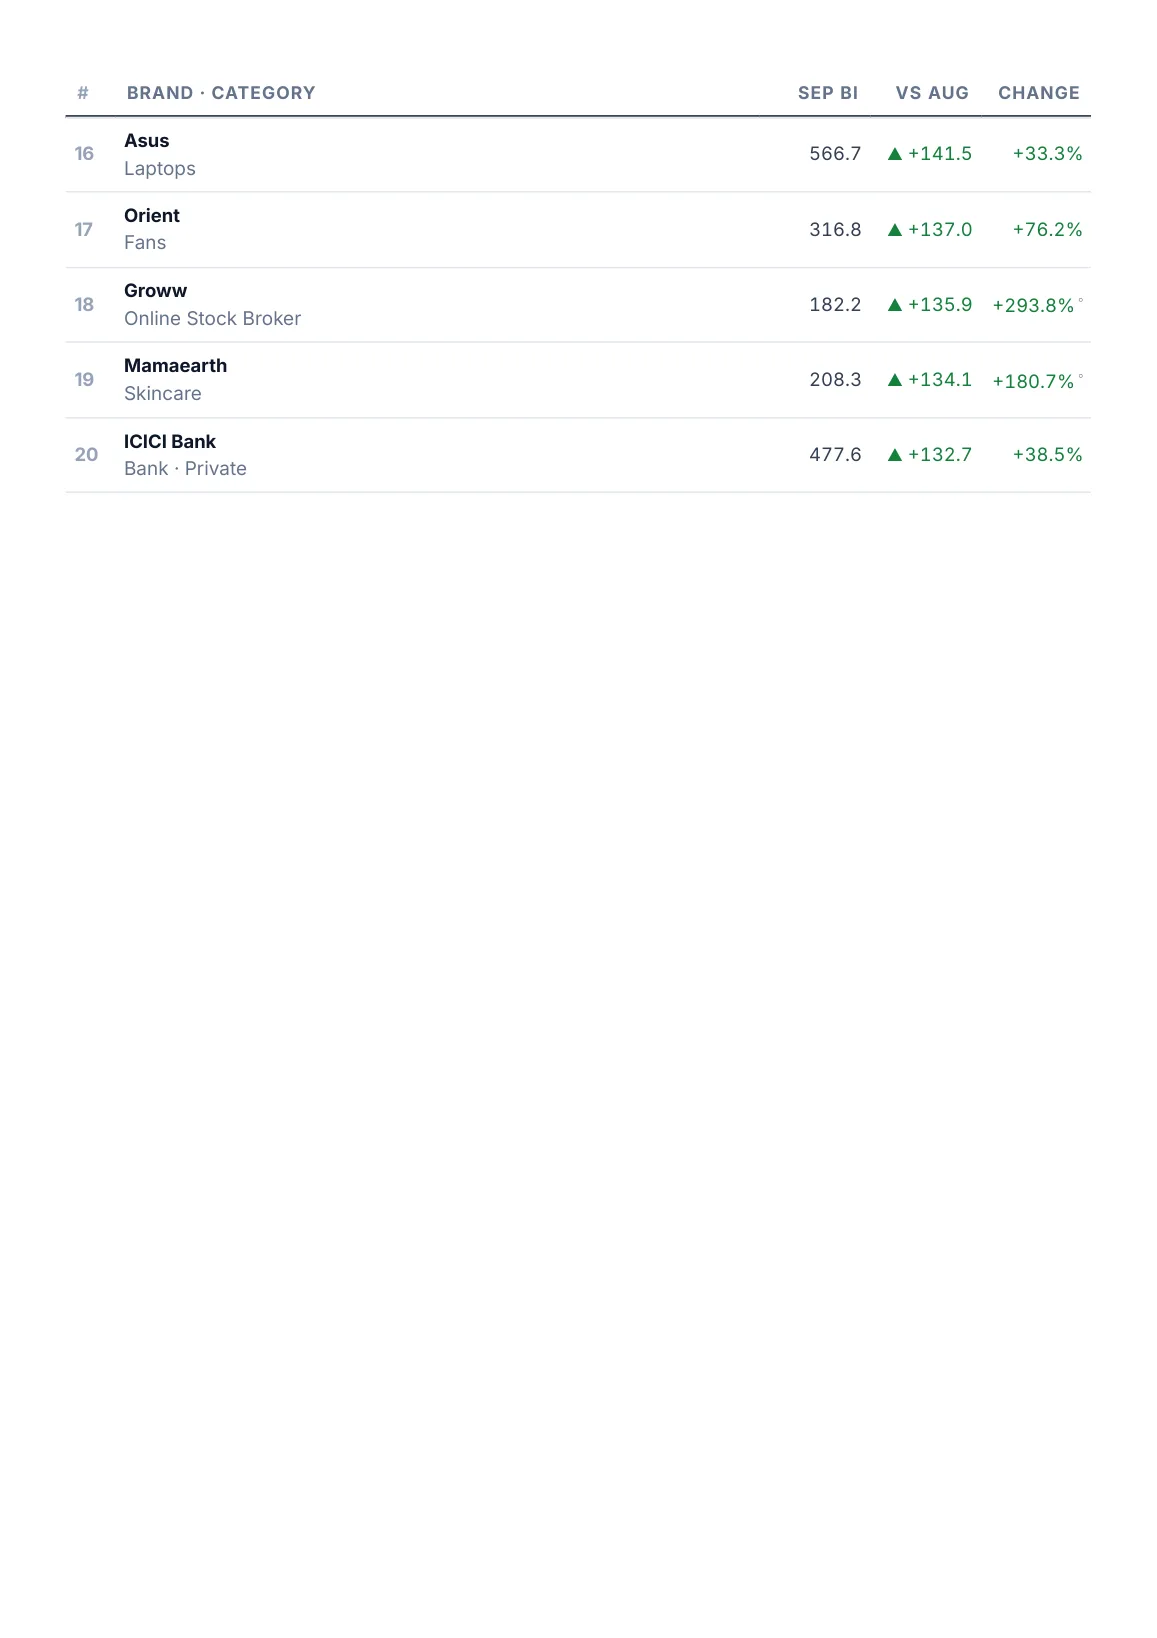
Page 11: the twenty biggest brand gains in Buying Intent, second part
Page 11 of 20
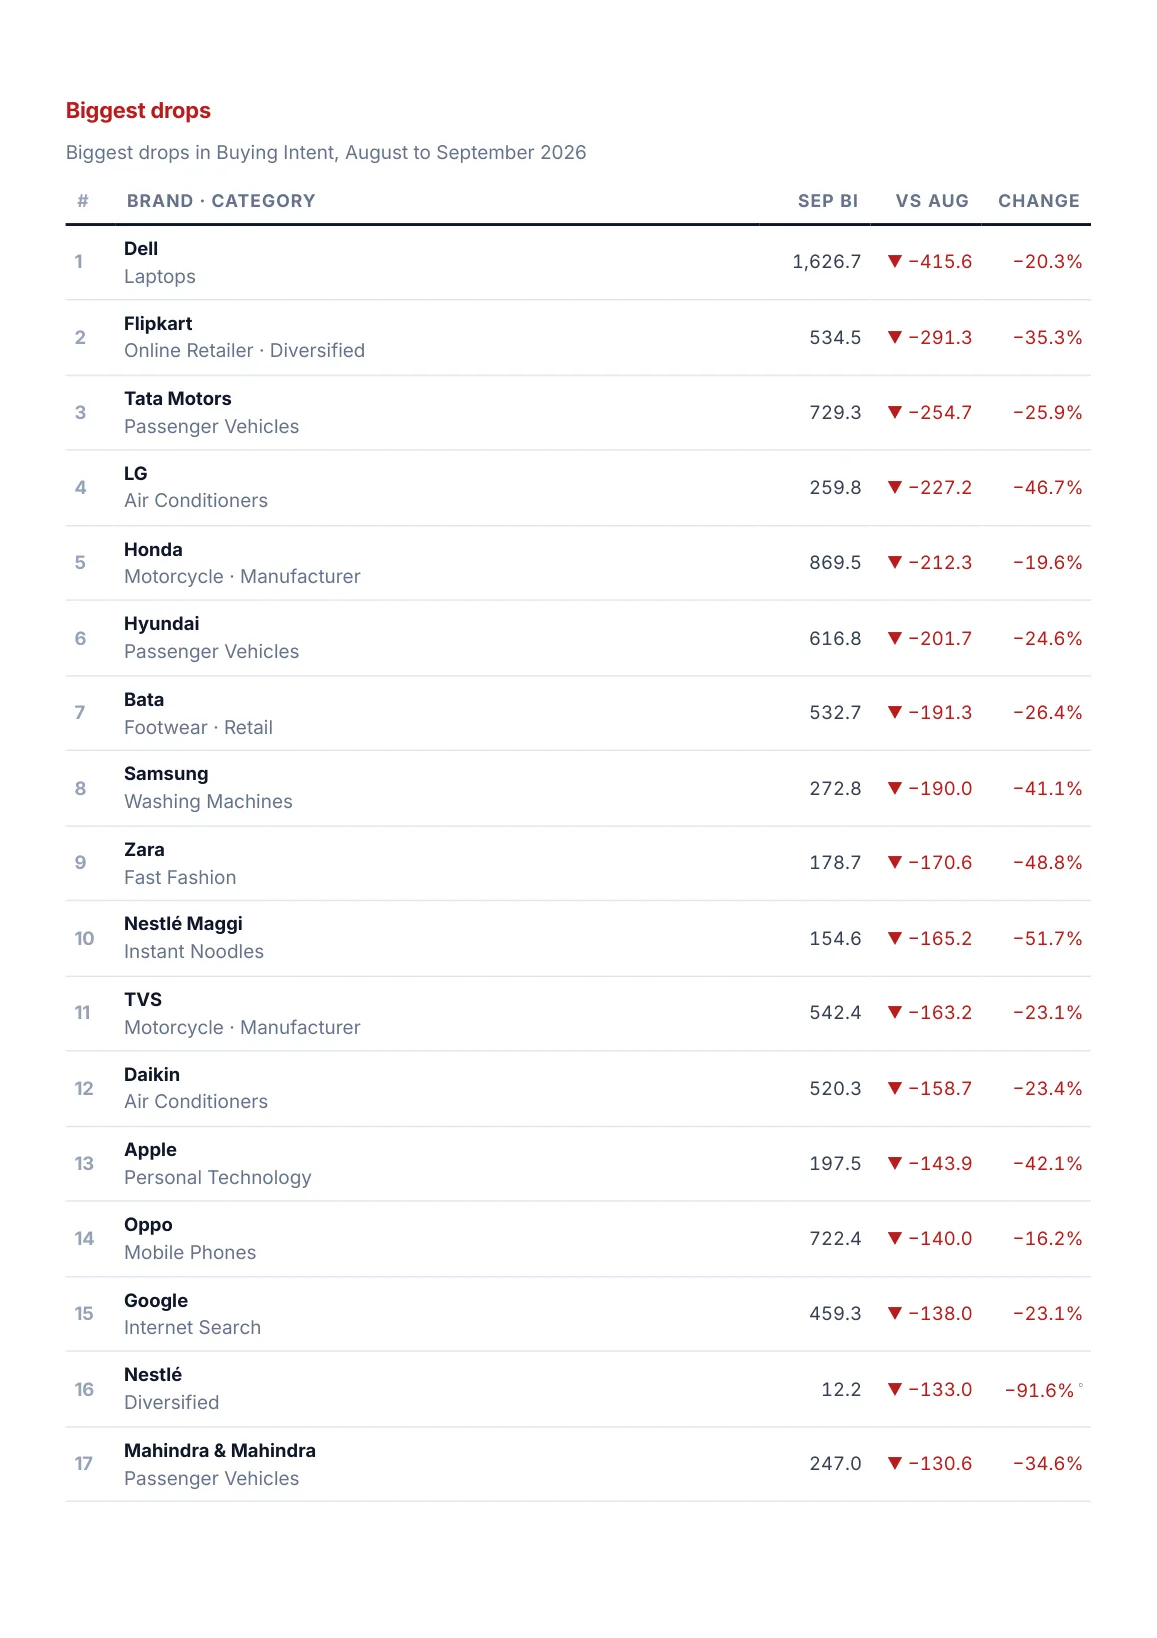
Page 12: the twenty biggest brand drops in Buying Intent, first part
Page 12 of 20
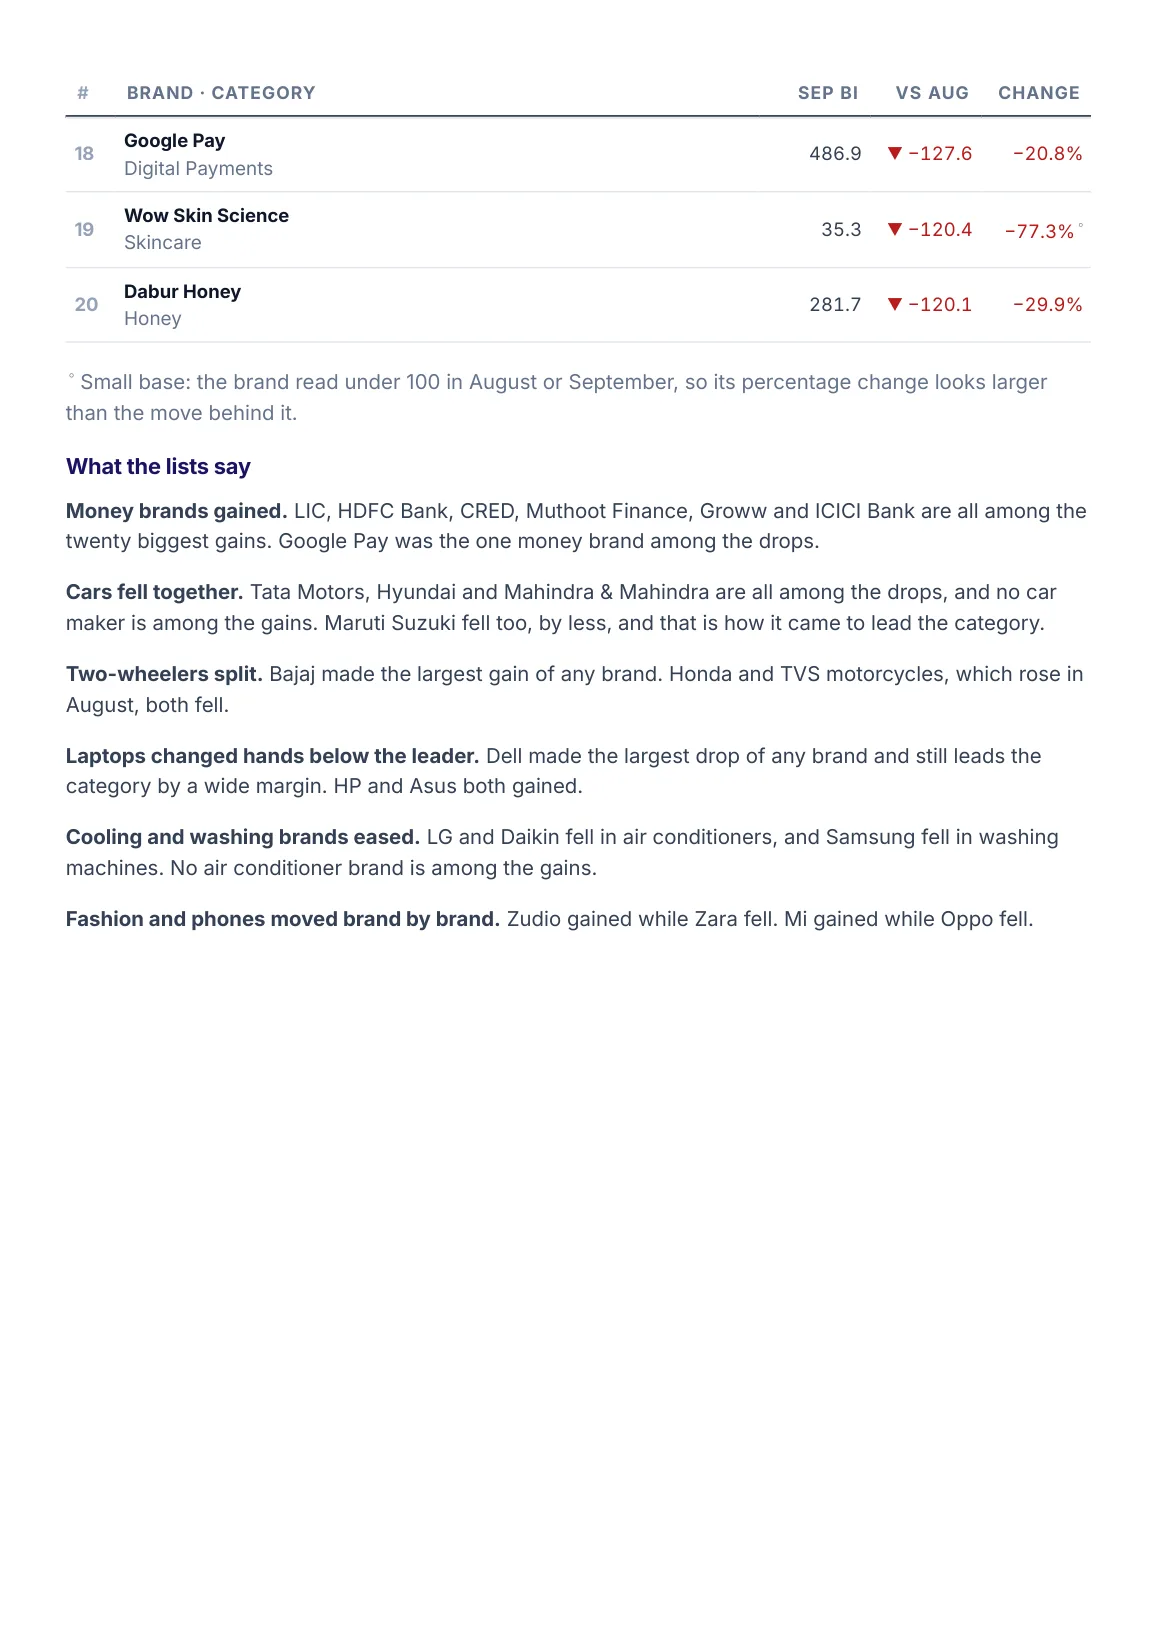
Page 13: the twenty biggest brand drops in Buying Intent, second part, and what the lists say
Page 13 of 20
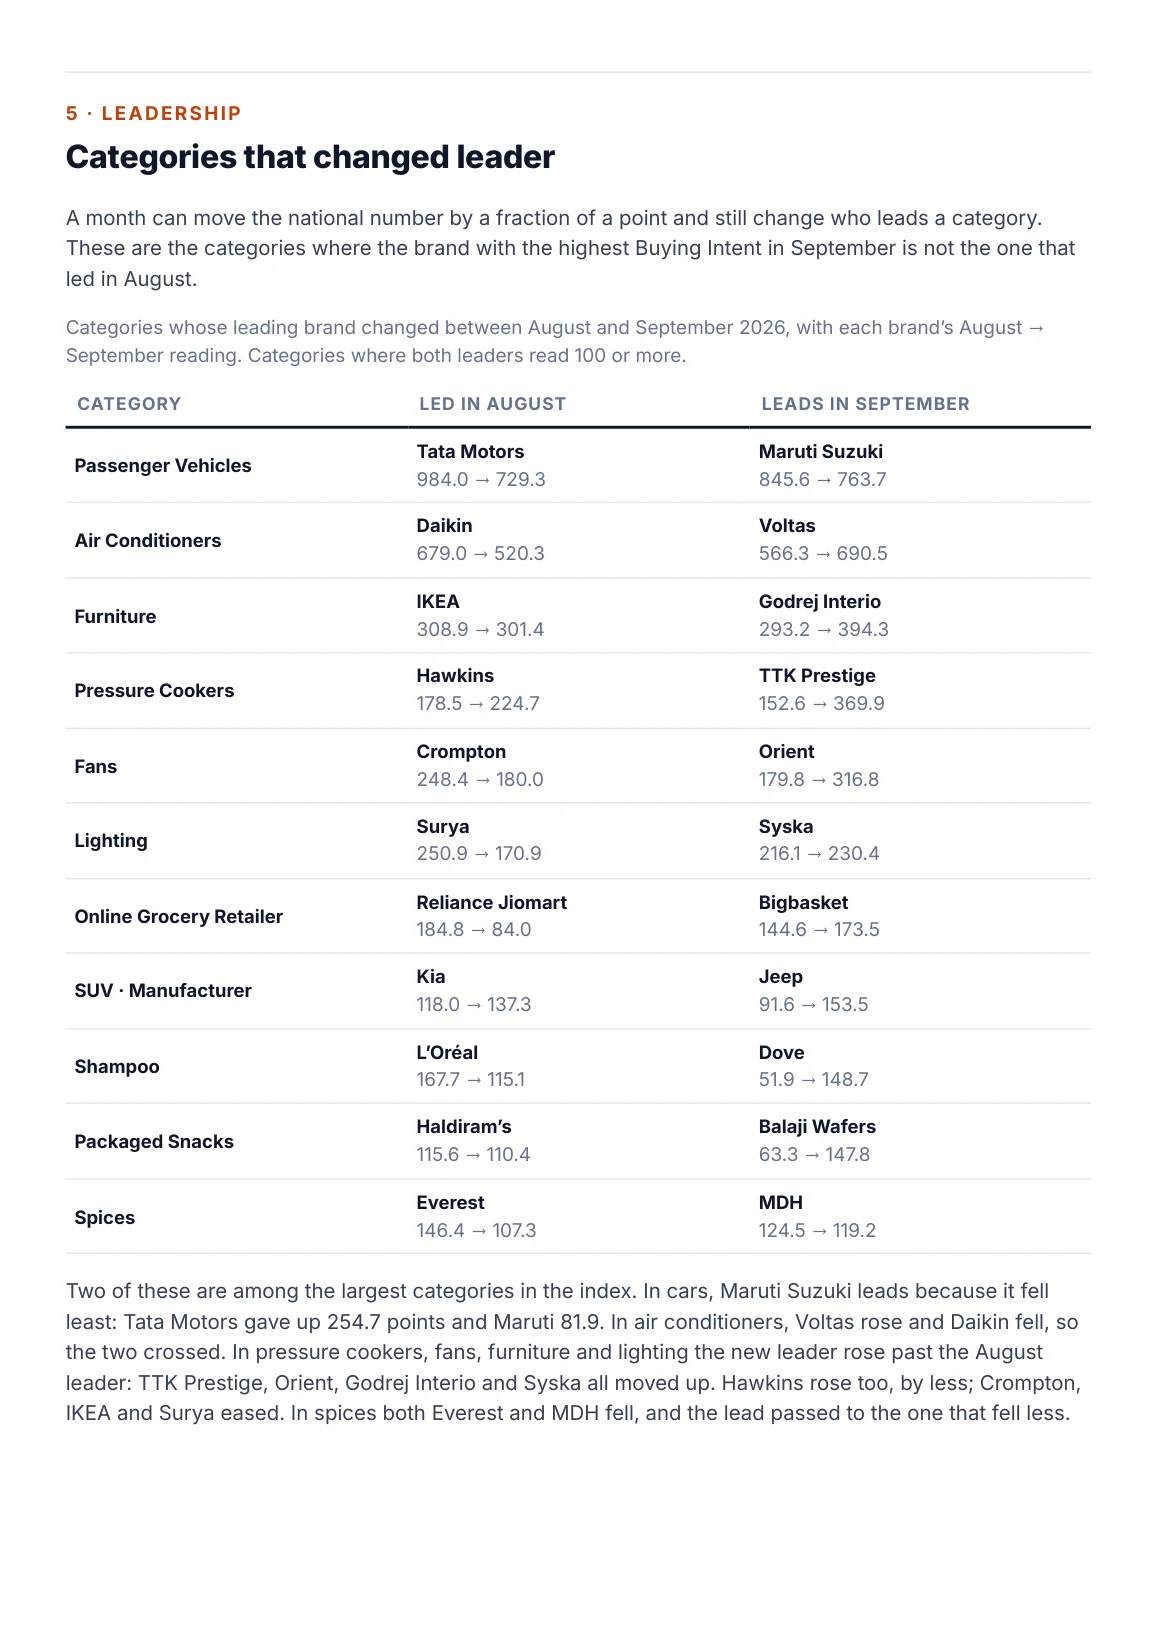
Page 14: the categories that changed leader between August and September
Page 14 of 20
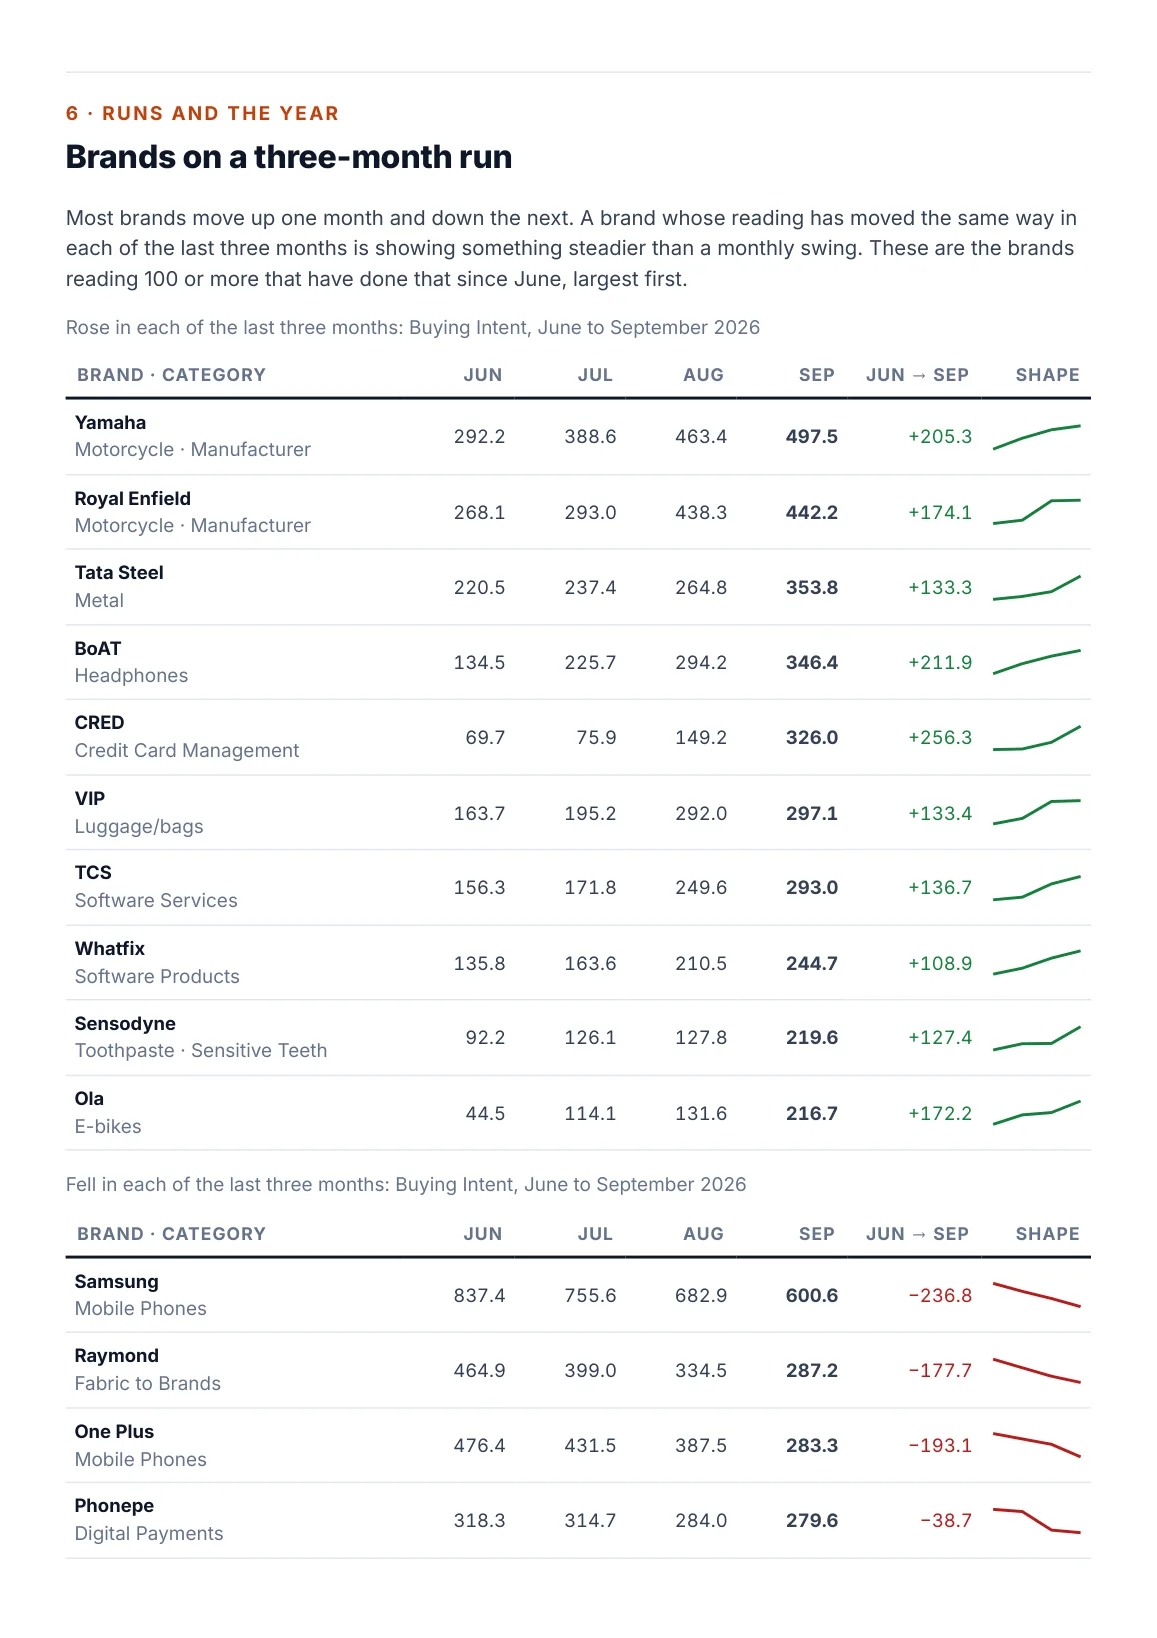
Page 15: brands that rose in each of the last three months
Page 15 of 20
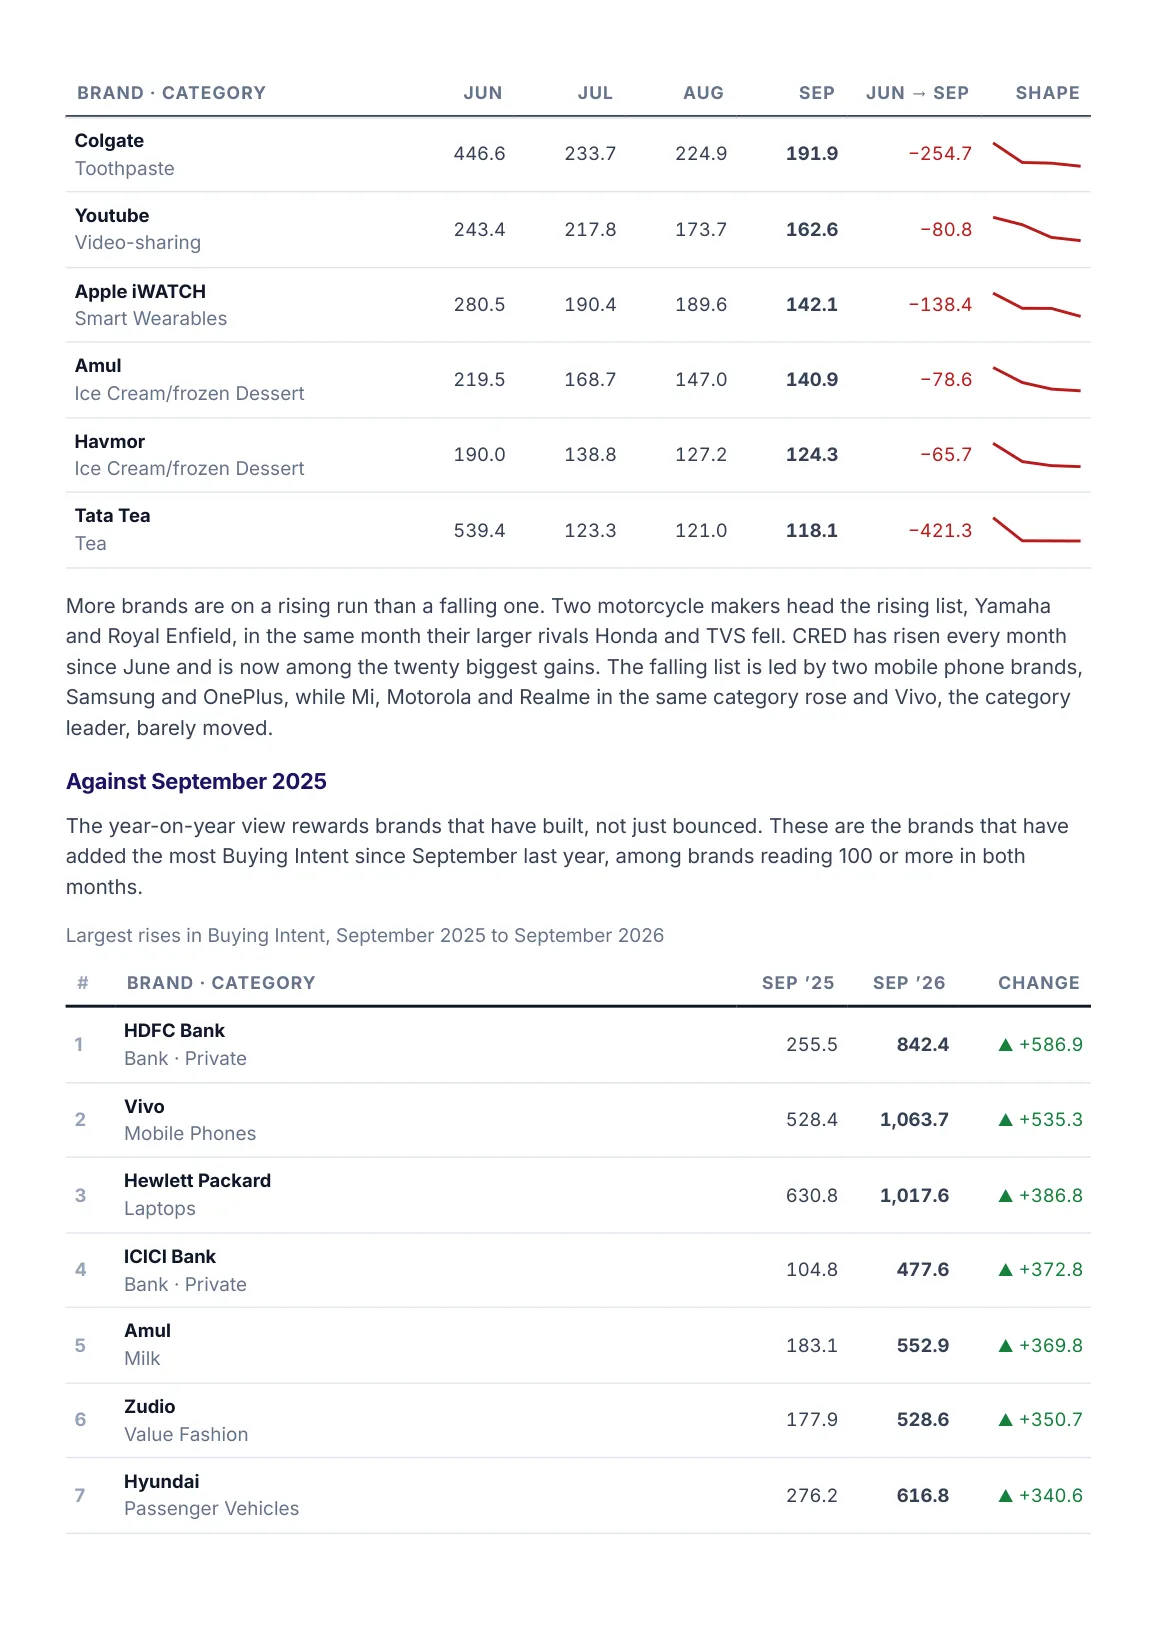
Page 16: brands that fell in each of the last three months, and the largest rises since September 2025
Page 16 of 20
Page 17: the largest rises since September 2025, continued
Page 17 of 20
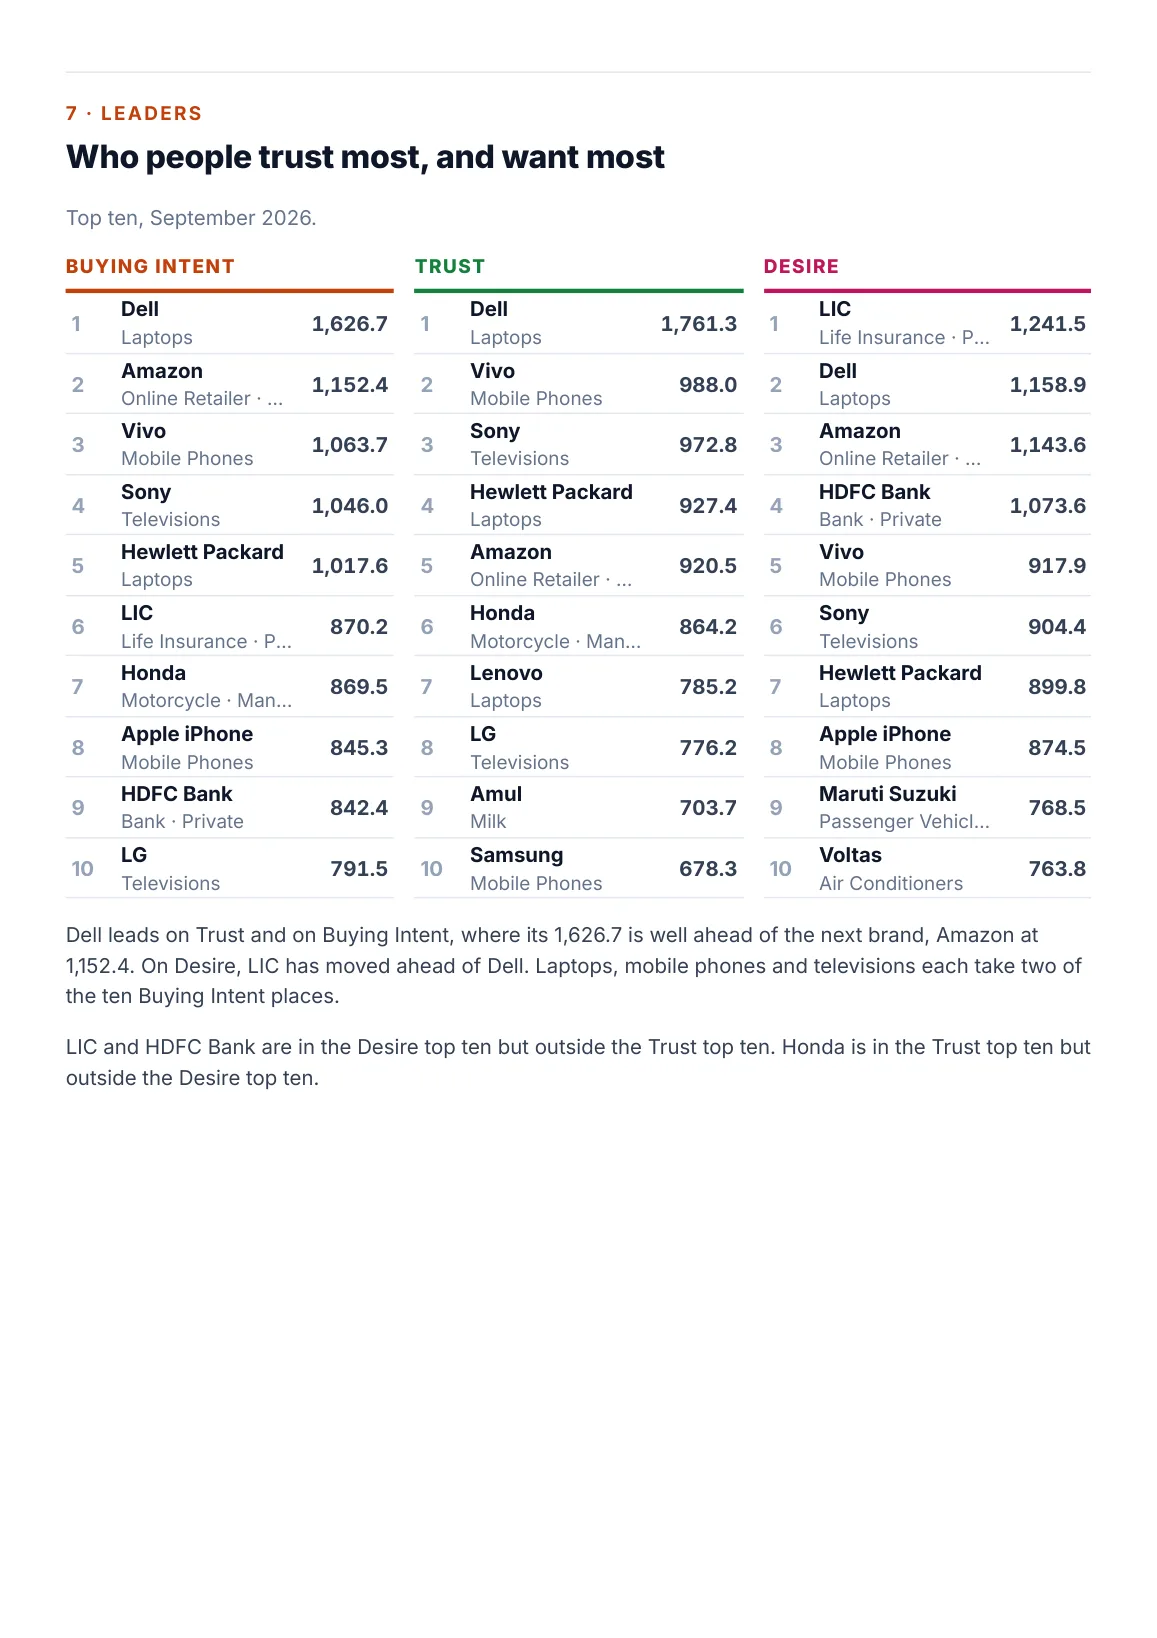
Page 18: highest Buying Intent, Trust and Desire in September
Page 18 of 20
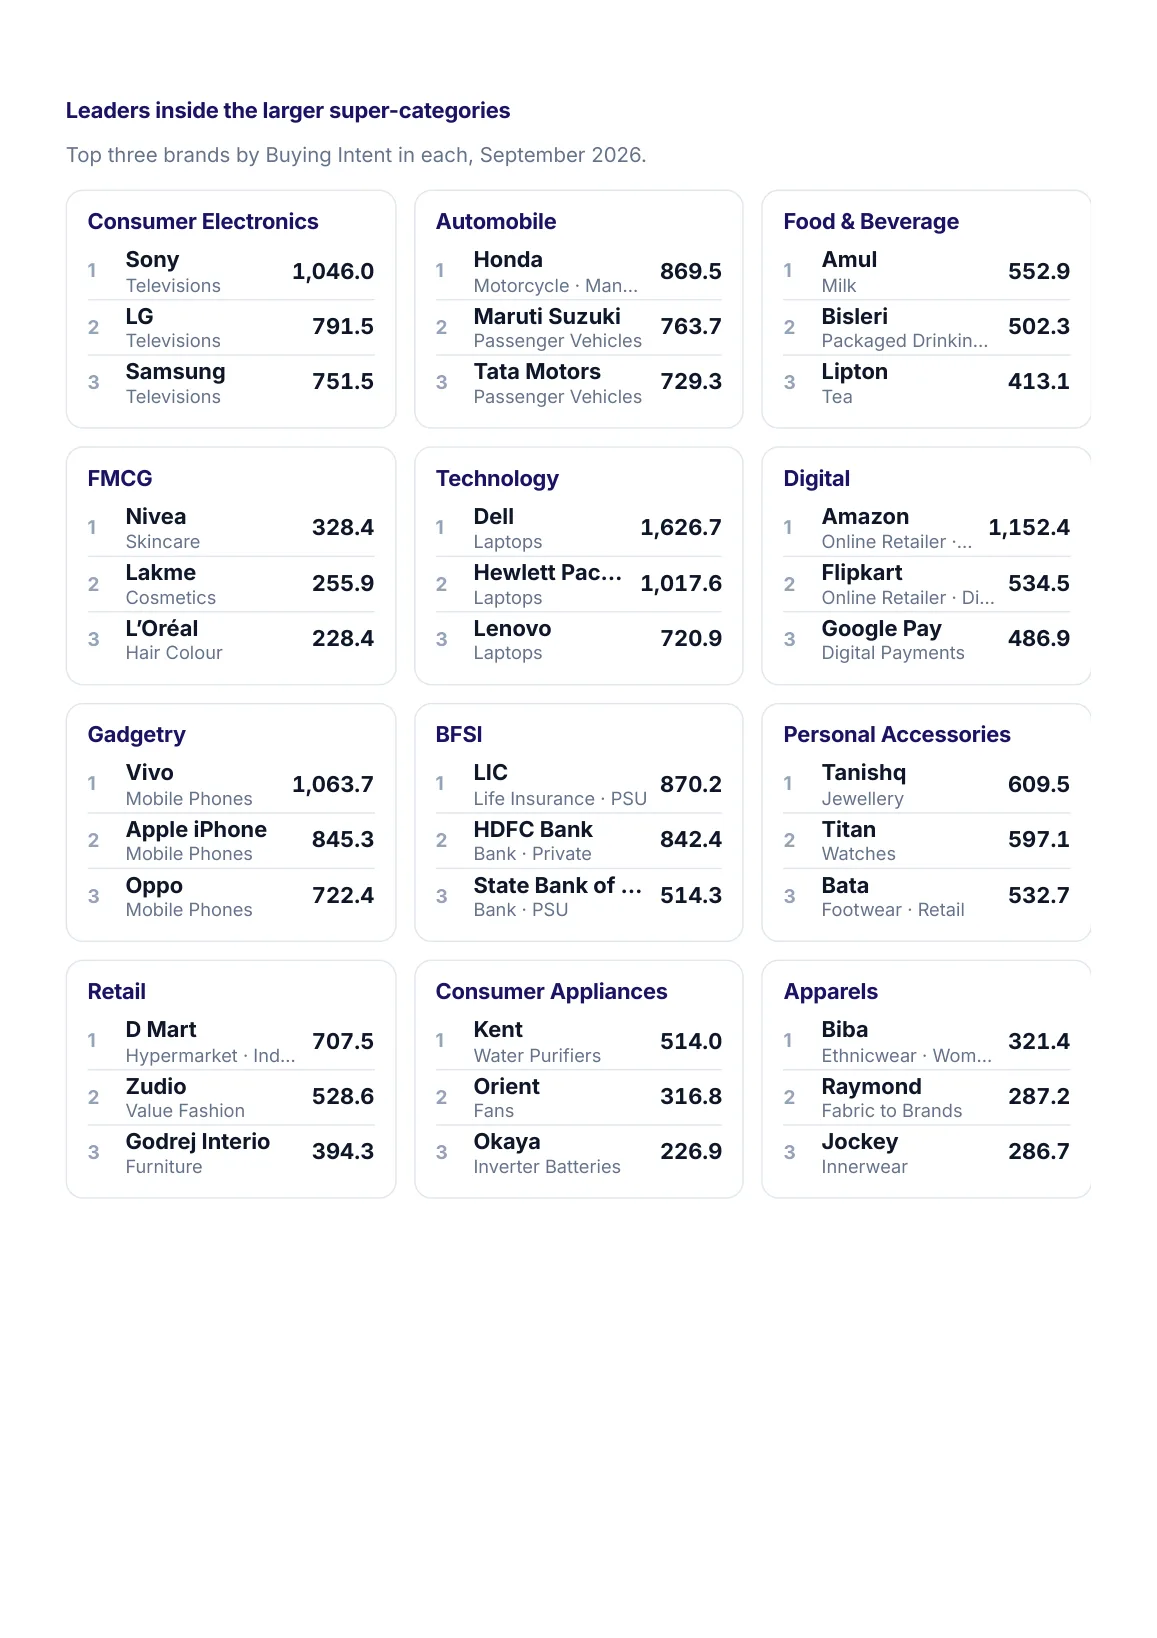
Page 19: the leading brands inside twelve larger super-categories
Page 19 of 20
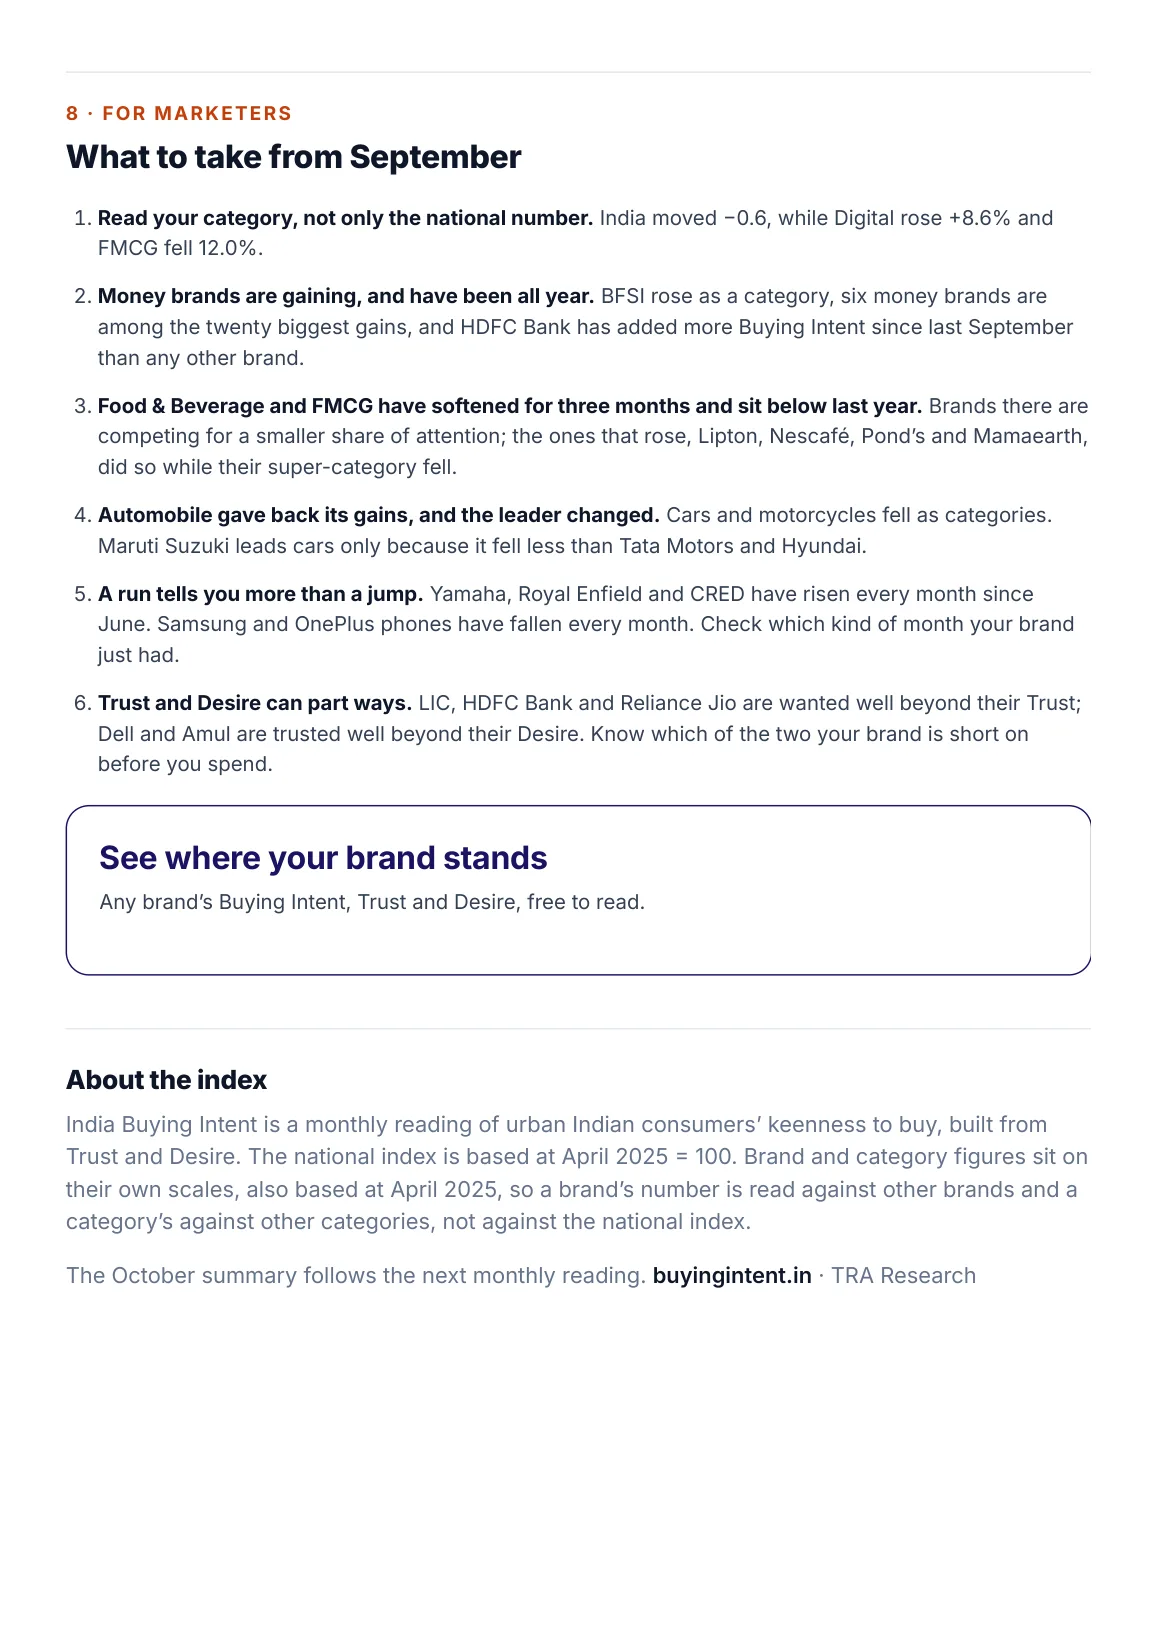
Page 20: what to take from September, and about the index
Page 20 of 20